

 Crime
Crime
This area boasts a crime rate that is far below the national average, making it a very safe place to live. These crime statistics encompass both property and violent offenses.
 Employment
With higher than average median household income, income per capita and lower unemployment rates, this area scores extremely well in the employment category.
 Housing
Impressive scores in the housing category characterize this area, potentially attributed to the availability of affordable housing, strong appreciation rates and high home values.
 Amenities
The majority of amenities will be difficult to reach within a short walk, often requiring residents to use a vehicle or public transportation for access.
 Commute
Low commute scores could be due to limited access to public transit in this area, as well as longer-than-average work commute times for residents.
 Cost Of Living
This area is known for its high cost of living, which means you should anticipate higher costs for everyday goods and services, housing, groceries, and health care.
 Health & Safety
Subpar air quality and the limited availability of certain health-related facilities such as hospitals, police stations, doctors and pharmacies may have contributed to the low score in this category.
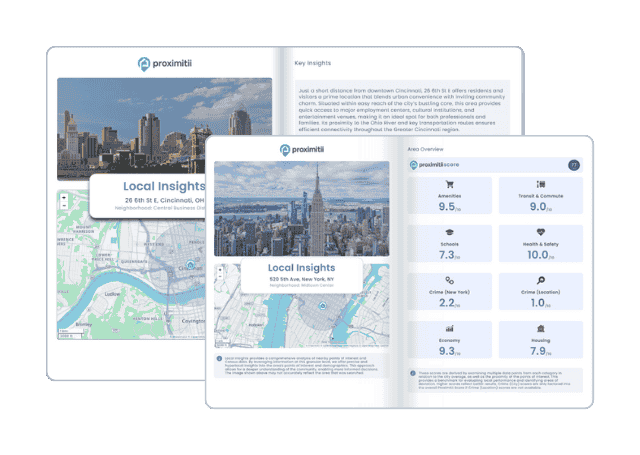
Why stop at city-to-city? With Local Insights, you can compare neighborhoods, zip codes, or even exact addresses. Access 300+ hyperlocal data points—from schools and crime to housing and amenities—to see which area is the better fit.

| Statistic | Toughkenamon | Pennsylvania | National |
| Average one way commute | 16min | 26min | 26min |
| Workers who drive to work | 52.9% | 76.5% | 76.4% |
| Workers who carpool | 24.9% | 8.5% | 9.3% |
| Workers who take public transit | 0.0% | 5.6% | 5.1% |
| Workers who bicycle | 0.0% | 0.5% | 0.6% |
| Workers who walk | 3.5% | 3.8% | 2.8% |
| Working from home | 11.0% | 4.2% | 4.6% |

 Here are the best places to live in Pennsylvania
 Most Dangerous Cities In The US
 Most Dangerous States In The US
 Check out the 10 safest cities in Pennsylvania