| Index | Tally Ho Farms | Tempe | Arizona |
| Cost of living | 105 | 119 | 101 |
| Groceries | 103 | 102 | 101 |
| Health care | 102 | 100 | 101 |
| Housing | n/a | 150 | 96 |
| Transportation | 102 | 102 | 102 |
| Utilities | 114 | 110 | 111 |
| Lifestyle & Entertainment | 108 | 107 | 103 |
| Household Items | 104 | 99 | 101 |
| Education & Childcare | 106 | 121 | 103 |


| Cost of living index | |
| Groceries index | |
| Health care index | |
| Housing index | |
| Transportation index | |
| Utilities index | |
| Lifestyle index | |
| Household index | |
| Educare index |
| Median Income | Per Year | Per Month | Max Budget (28% DTI) | Max Budget (36% DTI) |
| Household | $227,742 | $18,979 | $5,314 | $6,833 |
| State | General Sales Tax | With Max Surtax |
| Arizona | 5.6% | 10.725% |
| State | Income Tax (Low) | Income Tax (High) |
| Arizona | 2.5% | 2.5% |
| City | Population | Cost of Living Index | National Avg. |
| Upper Santan Village, AZ | 587 | 104 | 4.1% |
| Wet Camp Village, AZ | 119 | 105 | 4.9% |
| Sweet Water Village, AZ | 118 | 105 | 4.9% |
| Santa Cruz, AZ | 59 | 102 | 2.4% |
| Casa Blanca, AZ | 1,045 | 84 | 15.9% |
| Tempe, AZ | 197,595 | 119 | 18.6% |
| City | Population | Cost of Living Index | National Avg. |
| Burlington, ON | 197,435 | n/a | |
| Mobile, AL | 197,324 | 91 | 8.8% |
| Overland Park, KS | 197,888 | 114 | 14.1% |
| Shreveport, LA | 197,125 | 95 | 5.3% |
| Grand Prairie, TX | 198,327 | 100 | 0.1% |
| Tempe, AZ | 197,595 | 119 | 18.6% |

 Here are the best places to live in Arizona
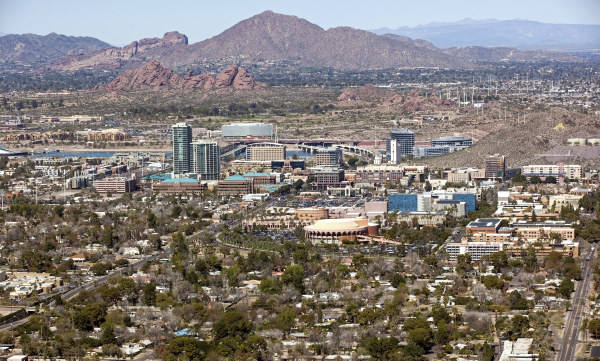 See the best places to live in Tempe
 Check out the 10 safest cities in Arizona
 Most Dangerous Cities In The US