
St. Louis, MO, known as 'The Gateway to the West,' offers a unique blend of historic significance and modern urban amenities. Located in eastern Missouri, St. Louis is a large city that serves as a major cultural and economic hub. Major nearby cities like Kansas City and Springfield enhance its status as a central point in the region. St. Louis's blend of historic landmarks, cultural festivals, and urban amenities creates a distinctive living experience.
St. Louis is home to several iconic landmarks, including the Gateway Arch, the historic Anheuser-Busch Brewery, and the Missouri Botanical Garden. The city offers a variety of attractions, from the beautiful Forest Park to the bustling Delmar Loop, known for its shopping and dining. St. Louis's dining scene is diverse, offering everything from St. Louis-style barbecue to international cuisine.
Annual events such as the St. Louis Art Fair and the Fair Saint Louis highlight the city's vibrant cultural scene and provide unique entertainment opportunities for residents and visitors. These events celebrate St. Louis's rich cultural heritage and community spirit. Prestigious institutions like Washington University in St. Louis contribute to the city's academic and cultural vibrancy, fostering a thriving intellectual community.
The arts and culture scene in St. Louis is dynamic and diverse, with numerous theaters, music venues, and art galleries. The St. Louis Symphony Orchestra and the Contemporary Art Museum St. Louis are just a few of the cultural landmarks that showcase the city's commitment to the arts. Living in St. Louis provides ample opportunities to engage with art, music, and history, making it an exciting place to call home.
St. Louis’s community is welcoming and diverse, creating a friendly environment for newcomers. The city is home to professional sports teams like the St. Louis Cardinals (MLB) and the St. Louis Blues (NHL), providing plenty of excitement for sports fans. Major industries in St. Louis include healthcare, education, and manufacturing, with significant employers such as BJC HealthCare and Boeing driving economic growth. The city has extensive public transit options, including buses and light rail, making commuting convenient. St. Louis's weather features hot summers and mild winters, allowing for a variety of outdoor activities year-round.

| Statistic | North Hampton | St. Louis | Missouri |
| Average one way commute | n/a | 24min | 23min |
| Workers who drive to work | 82.9% | 71.0% | 81.6% |
| Workers who carpool | 6.2% | 7.5% | 9.1% |
| Workers who take public transit | 4.2% | 7.3% | 1.5% |
| Workers who bicycle | 0.3% | 0.9% | 0.3% |
| Workers who walk | 0.7% | 4.6% | 1.9% |
| Working from home | 4.9% | 7.6% | 4.6% |

 Here are the best places to live in Missouri
 Check out the 10 most dangerous cities in Missouri
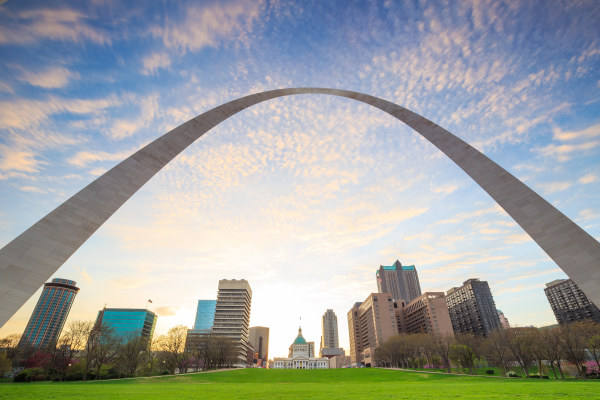 See the best places to live in St. Louis
 These are the largest cities in Missouri