
Living in Seattle, WA, known as 'The Emerald City,' offers a unique blend of natural beauty and urban sophistication. Located in the Pacific Northwest, Seattle is a large city renowned for its stunning waterfront, vibrant neighborhoods, and innovative tech industry. Major nearby cities like Tacoma and Bellevue enhance its appeal as a central hub in the region. Seattle's blend of natural beauty, cultural diversity, and cutting-edge innovation creates a distinctive living experience.
Seattle is home to several iconic landmarks, including the Space Needle, Pike Place Market, and the Museum of Pop Culture. The city offers a variety of attractions, from the beautiful Chihuly Garden and Glass to the bustling Seattle Art Museum, which features an impressive collection of contemporary and traditional art. Seattle's dining scene is diverse, offering everything from gourmet seafood restaurants to trendy food trucks.
Annual events such as the Seattle International Film Festival and Bumbershoot Music and Arts Festival highlight the city's dynamic cultural scene and provide unique entertainment opportunities for residents and visitors. These events celebrate Seattle's rich cultural heritage and community spirit. Prestigious institutions like the University of Washington and Seattle University contribute to the city's academic and cultural vibrancy, fostering a thriving intellectual community.
The arts and culture scene in Seattle is vibrant and diverse, with numerous theaters, music venues, and art galleries. The Seattle Symphony and the Pacific Northwest Ballet are just a few of the cultural landmarks that showcase the city's commitment to the arts. Living in Seattle provides ample opportunities to engage with art, music, and theater, making it an exciting place to call home.
Seattle’s community is welcoming and diverse, creating a friendly environment for newcomers. The city is home to professional sports teams like the Seahawks (NFL) and the Mariners (MLB), providing plenty of excitement for sports fans. Major industries in Seattle include technology, aerospace, and healthcare, with significant employers such as Amazon and Microsoft driving economic growth. The city has extensive public transit options, including buses, light rail, and ferries, making it easy to navigate and explore the region's many offerings. The city's mild, temperate climate, with its distinctive rainy season, adds to the charm of living in Seattle, making it a desirable place to call home.

| Statistic | Madison Valley | Seattle | Washington |
| Average one way commute | n/a | 28min | 27min |
| Workers who drive to work | 41.1% | 43.4% | 72.3% |
| Workers who carpool | 6.3% | 6.6% | 10.2% |
| Workers who take public transit | 30.0% | 20.5% | 6.2% |
| Workers who bicycle | 2.5% | 3.1% | 0.9% |
| Workers who walk | 8.3% | 10.8% | 3.6% |
| Working from home | 9.6% | 14.0% | 5.6% |

 Here are the best places to live in Washington
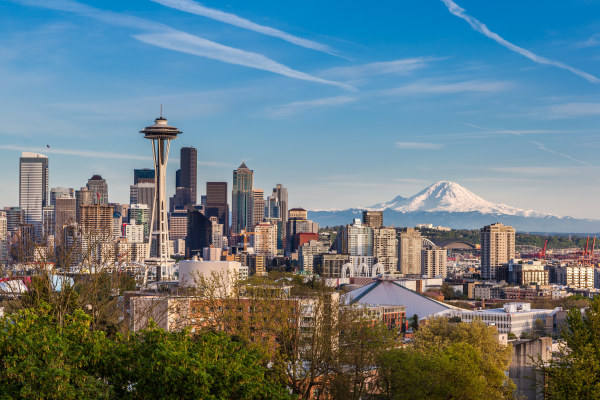 See the best places to live in Seattle
 Most Dangerous States In The US
 Safest States In The US