
Living in Seattle, WA, known as 'The Emerald City,' offers a unique blend of natural beauty and urban sophistication. Located in the Pacific Northwest, Seattle is a large city renowned for its stunning waterfront, vibrant neighborhoods, and innovative tech industry. Major nearby cities like Tacoma and Bellevue enhance its appeal as a central hub in the region. Seattle's blend of natural beauty, cultural diversity, and cutting-edge innovation creates a distinctive living experience.
Seattle is home to several iconic landmarks, including the Space Needle, Pike Place Market, and the Museum of Pop Culture. The city offers a variety of attractions, from the beautiful Chihuly Garden and Glass to the bustling Seattle Art Museum, which features an impressive collection of contemporary and traditional art. Seattle's dining scene is diverse, offering everything from gourmet seafood restaurants to trendy food trucks.
Annual events such as the Seattle International Film Festival and Bumbershoot Music and Arts Festival highlight the city's dynamic cultural scene and provide unique entertainment opportunities for residents and visitors. These events celebrate Seattle's rich cultural heritage and community spirit. Prestigious institutions like the University of Washington and Seattle University contribute to the city's academic and cultural vibrancy, fostering a thriving intellectual community.
The arts and culture scene in Seattle is vibrant and diverse, with numerous theaters, music venues, and art galleries. The Seattle Symphony and the Pacific Northwest Ballet are just a few of the cultural landmarks that showcase the city's commitment to the arts. Living in Seattle provides ample opportunities to engage with art, music, and theater, making it an exciting place to call home.
Seattle’s community is welcoming and diverse, creating a friendly environment for newcomers. The city is home to professional sports teams like the Seahawks (NFL) and the Mariners (MLB), providing plenty of excitement for sports fans. Major industries in Seattle include technology, aerospace, and healthcare, with significant employers such as Amazon and Microsoft driving economic growth. The city has extensive public transit options, including buses, light rail, and ferries, making it easy to navigate and explore the region's many offerings. The city's mild, temperate climate, with its distinctive rainy season, adds to the charm of living in Seattle, making it a desirable place to call home.
 Amenities
Conveniently located, the area boasts a variety of amenities, including grocery stores, shopping, coffee shops and entertainment options all within walking distance.
 Commute
The high commute score in this area could imply easy access to public transportation, as well as shorter-than-average commute times to your workplace.
 Employment
With higher than average median household income, income per capita and lower unemployment rates, this area scores extremely well in the employment category.
 Health & Safety
Accessible health facilities like hospitals, doctors offices, clinics and nursing homes as well as good air quality are all factors that have led to a high score in this category.
 Schools
The high score in the schools category can be attributed to outstanding test scores, elevated graduation rates and the convenient placement of elementary and high schools in this area.
 Cost Of Living
This area is known for its high cost of living, which means you should anticipate higher costs for everyday goods and services, housing, groceries, and health care.
 Crime
Crime
Reporting high crime rates per 100,000 people, this area may be perceived as an unsafe place to reside. These statistics encompass both violent and property crime rates.
 Ratings
Through surveys and polls, AreaVibes obtained feedback from local residents in the area, and the results did not indicate a favorable outlook on factors like local amenities and the safety of the area.
Seattle is a big city located in the state of Washington. The city has a population of 765,050 people. Seattle has a population density of 9,126 people per square mile. This would be considered well above the national population density level. If we look at the most recent Census, Seattle is known to have a predominantly White population. The next two most common races are Asian and Black. Seattle is not known to have a high population (over 15 years old) of married people. At only 44% married, this city falls well below the national average. On a daily basis, the typical American spends approximately 26 minutes on their one-way work commute. Reduced travel times not only contributes to increased overall happiness, but also affords more opportunities to cherish moments with family and friends. If you're living in Seattle, your commute time will align closely with the national average, spanning a one-way duration of approximately 28 minutes.
Living in Seattle can be a fulfilling experience for anyone moving to the area. Having said that, in the state of Washington, there are many desirable places to live, so choose wisely! When searching for a new neighborhood, several factors play a vital role in determining its suitability. Safety should be a top priority, ensuring a secure environment with low crime rates. Proximity to your workplace or school helps minimize commuting time and allows for a better work-life balance. Availability of essential amenities such as parks, coffee shops, restaurants, grocery stores, and healthcare facilities contributes to convenience and well-being. Access to reliable public transportation options facilitates easy commuting and connectivity. Additionally, considering the sense of community and the overall atmosphere that resonates with your lifestyle and preferences fosters a harmonious living experience. To help you find the best places to live in and around Seattle, AreaVibes has created a livability score using key metrics like crime, cost of living, education, employment, housing and more.
The livability score in Seattle is 75/100 and the city is ranked in the 87th percentile of all cities across America. Pack your bags! This is a very high score in comparison to other US cities. Living in Seattle could be a great choice! If we dig down a little deeper into each category within the livability score, we see that Seattle has higher than average grades for the following: education (A) and housing (B). There are some categories that Seattle does not rank well for, including: crime (F) and cost of living (F). It might be worth taking a closer look to find out why.
Seattle has many conveniently situated amenities and captivating attractions that adds to the continuous enjoyment of your everyday life. Having the assurance of abundant conveniences and a wide array of activities ensures your easy access to nearby grocery stores, restaurants, bars, fitness facilities, coffee shops and exciting entertainment options. This not only simplifies daily routines but also fosters a vibrant and dynamic lifestyle within the community. With a wealth of resources at your fingertips, you can savor the convenience and variety that Seattle has to offer, making it a desirable destination for those seeking both accessibility and enjoyment in their daily lives. Some of the interesting things to do and attractions include: Pike Place Market, Pike Place Market, and Space Needle.
A robust real estate market serves as a crucial economic indicator, reflecting the local area's strength, stability and the confidence of its residents. Seattle excels in the housing sector, scoring high marks based on factors such as median home and rental prices, appreciation rates and home affordability. These calculations suggest that the apartment rental and real estate market in the region is exceptionally healthy, highlighting the area's economic vitality and attractiveness to potential homebuyers and renters.
Being close to public transit, grocery stores, parks and other conveniences are all important when weighing your options for a new home in Seattle. Before you determine if any of these amenities are available in the area, you will also want to know if the real estate prices in Seattle are affordable. Median real estate prices in Seattle come in at $1,265,605, which is 157.3% higher than the Washington average. The home price to income ratio compares the median home prices to the median household income. In Seattle, the home price to income ratio is 8.6, which is 59.3% higher than the Washington average.

| Statistic | Seattle | Washington | National |
| Average one way commute | 28min | 27min | 26min |
| Workers who drive to work | 43.4% | 72.3% | 76.4% |
| Workers who carpool | 6.6% | 10.2% | 9.3% |
| Workers who take public transit | 20.5% | 6.2% | 5.1% |
| Workers who bicycle | 3.1% | 0.9% | 0.6% |
| Workers who walk | 10.8% | 3.6% | 2.8% |
| Working from home | 14.0% | 5.6% | 4.6% |

 Here are the best places to live in Washington
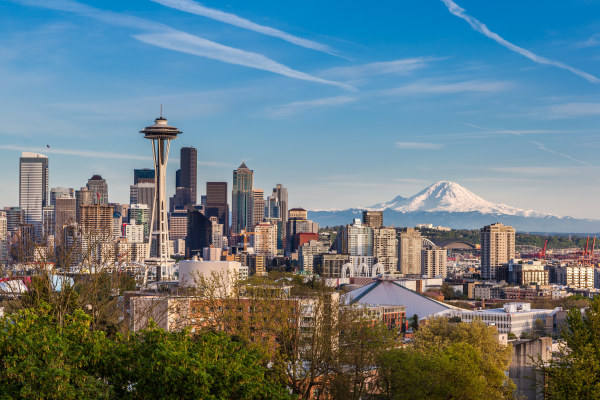 See the best places to live in Seattle
 Most Dangerous States In The US
 Check out the 10 safest cities in Washington