
Living in San Ramon, CA offers a suburban lifestyle with a focus on innovation, education, and outdoor recreation. Located in the heart of the San Ramon Valley, San Ramon is known for its beautiful landscapes, top-rated schools, and thriving business community. The city is home to the headquarters of several major corporations, including Chevron and 24 Hour Fitness, making it a hub of economic activity in the East Bay region.
San Ramon’s dining scene is diverse, offering a range of options from casual cafes to upscale restaurants. The city’s downtown area, known as City Center Bishop Ranch, is a vibrant hub of activity, featuring shops, restaurants, and entertainment venues, as well as beautifully designed public spaces that encourage community gathering. The annual Art and Wind Festival is a local favorite, celebrating the city’s creative spirit with art displays, live music, and kite flying.
For outdoor enthusiasts, San Ramon provides plenty of opportunities for recreation. The city is surrounded by scenic hills and open spaces, including the Las Trampas Regional Wilderness and the Iron Horse Regional Trail, which offer miles of trails for hiking, biking, and horseback riding. The city’s parks, including Central Park and Athan Downs, provide facilities for sports, picnics, and community events.
San Ramon is also known for its strong commitment to education and family-friendly environment. The city’s schools are part of the highly regarded San Ramon Valley Unified School District, making it a popular choice for families. San Ramon hosts a variety of events throughout the year, including the Summer Concert Series and the Fourth of July Celebration, which bring residents together to enjoy the community spirit and festive atmosphere.
For those considering a move to California, San Ramon offers a perfect blend of suburban comfort, innovation, and natural beauty. Whether you're drawn by its outdoor activities, excellent schools, or thriving business environment, living in San Ramon, CA provides a fulfilling and enriching lifestyle.
 Amenities
Conveniently located, the area boasts a variety of amenities, including grocery stores, shopping, coffee shops and entertainment options all within walking distance.
 Commute
The high commute score in this area could imply easy access to public transportation, as well as shorter-than-average commute times to your workplace.
 Crime
Crime
This area boasts a crime rate that is far below the national average, making it a very safe place to live. These crime statistics encompass both property and violent offenses.
 Employment
With higher than average median household income, income per capita and lower unemployment rates, this area scores extremely well in the employment category.
 Health & Safety
Accessible health facilities like hospitals, doctors offices, clinics and nursing homes as well as good air quality are all factors that have led to a high score in this category.
 Cost Of Living
This area is known for its high cost of living, which means you should anticipate higher costs for everyday goods and services, housing, groceries, and health care.
San Ramon is a mid-sized city located in the state of California. The city has a population of 83,423 inhabitants. San Ramon has a population density of 4,461 people per square mile. This would be considered well above the national population density level. Individuals of White (40%) and Asian (48%) backgrounds make up a significant portion of the population of San Ramon. Something to be aware of when living in San Ramon are the above average commute times. If you're looking for a short commute to work, this might not be the right area for you. With one way commute time of 38 minutes, this comes in much higher than the national average of 26 minutes.
Without the right tools, moving to any new town can be very stressful and challenging. Living in San Ramon, California could be a fulfilling experience for anyone who puts in the effort to do the research required. When searching for a new neighborhood, several key items should be considered. Safety is paramount, ensuring a secure environment for you and your family. Proximity to workplaces or schools reduces commuting time and enhances convenience. Access to amenities like parks, grocery stores and healthcare facilities contributes to a comfortable lifestyle. Reliable public transportation options promote easy mobility. A strong sense of community fosters social connections and a welcoming atmosphere. The best areas in San Ramon and in surrounding cities are easier to find when you are able to make informed decisions. Using data from crime, cost of living, commute, health & safety, you will see a detailed breakdown of the most important information as well as comparisons to the California and national averages.
With a livability score of 87/100, San Ramon is ranked #258 in the United States and #3 in California. Clearly, San Ramon is doing something right, as this score ranks well above the average of most cities. The cherry on top is that San Ramon also ranks in the top 10 percent of all cities. If we probe a little deeper into each category within the livability score, we see that San Ramon has higher than average grades for the following: crime (A+), education (A+) and housing (B). On a more negative note, San Ramon does not have favorable ranks for the following: cost of living (F). If we take a look at the data, we can find out why.
If you're considering living in San Ramon, it comes with numerous advantages, particularly in the form of an extensive selection of local amenities. These amenities play a pivotal role in elevating the quality of life within this vibrant community. From easily accessible grocery stores, to conveniently located fitness facilities, a diverse range of dining establishments and a multitude of shopping options, San Ramon provides a comprehensive array of resources for its residents. This ensures the effortless fulfillment of your daily needs and creates ample opportunities for relaxation and recreation. The convenience of these local offerings greatly contributes to the overall appeal of the area, making it an enticing destination for those in search of convenience, diversity, and a gratifying lifestyle. If you're contemplating a move, the abundance of local amenities could very well be a defining characteristic of this area.
Crime rates can be the deciding factor for anyone looking to relocate to a new area, as the result is often a greater level of safety and security as well as an improved quality of life. San Ramon gets top scores for their low violent crime rates of 86 crimes per 100,000 residents, which are significantly lower than the national average.
Test scores can be a good way to measure a school's academic performance and the proficiency of its students. They can be an important metric in deciding if the local area schools can provide a solid educational system for children. The schools in San Ramon have an average test score of 78%, which is well above the US average.
For home buyers, real estate will be the largest purchase they will ever make and it will also be their most valuable asset. For renters, the monthly rent paid on their San Ramon apartments will most likely be their largest expense. Based on tangible metrics like home and rental affordability and appreciation rates, housing in this area has received a score that is well above the average of every other US city. A thriving real estate market can also generate strong local economic activity and job creation.
Being close to public transit, grocery stores, parks and other conveniences are all important when weighing your options for a new home in San Ramon. Before you determine if any of these amenities are available in the area, you will also want to know if the real estate prices in San Ramon are affordable. The median home price for San Ramon homes is $1,794,990, which is 145.3% higher than the California average. If we take a closer look at the affordability of homes in San Ramon, we’ll see that the home price to income ratio is 7.3, which is 5.2% lower than the California average.

| Statistic | San Ramon | California | National |
| Average one way commute | 38min | 28min | 26min |
| Workers who drive to work | 67.6% | 73.5% | 76.4% |
| Workers who carpool | 7.3% | 10.6% | 9.3% |
| Workers who take public transit | 8.4% | 5.2% | 5.1% |
| Workers who bicycle | 0.2% | 1.1% | 0.6% |
| Workers who walk | 0.8% | 2.7% | 2.8% |
| Working from home | 14.9% | 5.4% | 4.6% |

 Here are the best places to live in California
 Check out the 10 safest cities in California
 Check out the 10 most dangerous cities in California
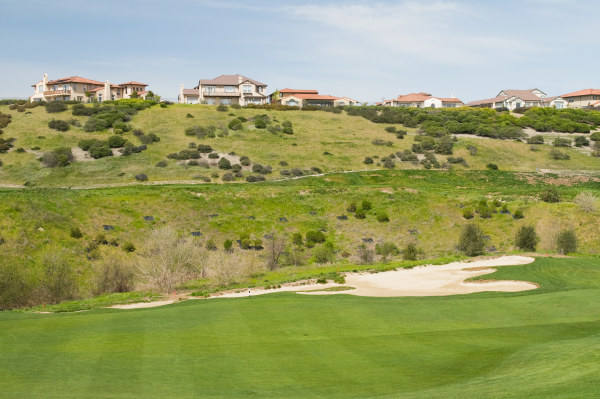 See the best places to live in San Ramon