| Index | Old Northwest-West University | Reno | Nevada |
| Cost of living | 100 | 126 | 103 |
| Groceries | 101 | 101 | 102 |
| Health care | 100 | 100 | 103 |
| Housing | 92 | 177 | 103 |
| Transportation | 101 | 101 | 103 |
| Utilities | 110 | 110 | 111 |
| Lifestyle & Entertainment | 108 | 108 | 103 |
| Household Items | 103 | 103 | 102 |
| Education & Childcare | 109 | 109 | 104 |


| Cost of living index | |
| Groceries index | |
| Health care index | |
| Housing index | |
| Transportation index | |
| Utilities index | |
| Lifestyle index | |
| Household index | |
| Educare index |
| Median Income | Per Year | Per Month | Max Budget (28% DTI) | Max Budget (36% DTI) |
| Household | $67,394 | $5,616 | $1,572 | $2,022 |
| State | General Sales Tax | With Max Surtax |
| Nevada | 6.85% | 8.25% |
| State | Income Tax (Low) | Income Tax (High) |
| Nevada | 0% | 0% |
| City | Population | Cost of Living Index | National Avg. |
| Floriston, CA | 30 | 104 | 3.8% |
| Sun Valley, NV | 21,634 | 104 | 3.7% |
| Lemmon Valley, NV | 5,354 | 116 | 16.1% |
| Cold Springs, NV | 11,088 | 119 | 18.7% |
| Sparks, NV | 105,155 | 121 | 21.4% |
| Reno, NV | 258,532 | 126 | 25.7% |
| City | Population | Cost of Living Index | National Avg. |
| Burnaby, BC | 258,827 | n/a | |
| Kitchener, ON | 259,162 | n/a | |
| North Las Vegas, NV | 256,144 | 114 | 13.7% |
| Scottsdale, AZ | 261,070 | 145 | 45.4% |
| Glendale, AZ | 255,914 | 109 | 9.4% |
| Reno, NV | 258,532 | 126 | 25.7% |

 Here are the best places to live in Nevada
 Most Dangerous States In The US
 Safest Cities In The US
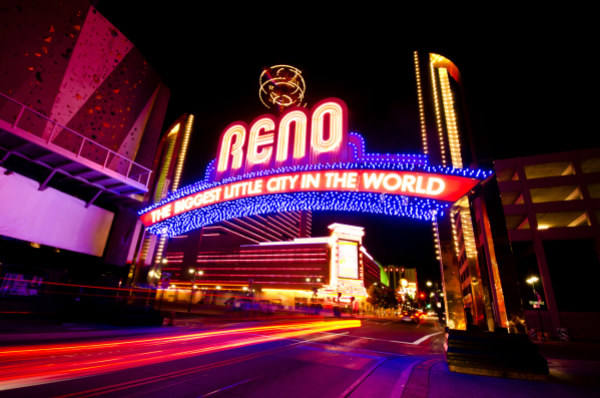 See the best places to live in Reno