| Statistic | Redmond | Washington | National |
| Population | 67,959 | 7,614,893 | 328,239,523 |
| Population density (sq mi) | 4,102 | 117 | 91 |
| Median age | 34.5 | 37.6 | 37.7 |
| Male/Female ratio | 1.0:1 | 1.0:1 | 1.0:1 |
| Married (15yrs & older) | 64% | 56% | 55% |
| Families w/ Kids under 18 | 53% | 44% | 43% |
| Speak English | 55% | 81% | 79% |
| Speak Spanish | 5% | 8% | 13% |
The demographics of Redmond offer invaluable insights into the composition, dynamics and needs of both urban and rural areas, empowering planners, developers and policymakers to foster prosperity, equity, and well-being for all residents. With a population of 67,959, Redmond exhibits a population density of 4,102 people per square mile, contrasting with the national average of 91. The median age stands at 34.5, with 64% of individuals aged 15 or older being married and 53% having children under 18. In terms of income equality in Redmond, 9% of households report a median income below $25,000, while 53% report an income exceeding $150,000, showcasing a diverse economic landscape.
The 5 largest ethnic groups in Redmond are 53.7% White, 1.7% Black or African American, 36.8% Asian, 0.7% American Indian and 0.2% Native Hawaiian, with 7.6% of the population identifying as Hispanic or Latino. Of note, 54.5% of households reported speaking English only, while 4.7% reported speaking Spanish only. Additionally, 40.6% of residents were classified as foreign-born. The Redmond racial demographics and ethnicity breakdown are essential for comprehending and addressing systemic inequities, advancing social justice and inclusion and cultivating resilient communities.
In areas with high population density, residents enjoy a wealth of amenities and services conveniently located within walking distance or a short commute. Access to healthcare facilities, educational institutions, cultural venues, dining options, retail stores and public transit enhances residents' quality of life and overall well-being. Redmond has a population density of 4,102 people per square mile, which far exceeds the national average of 91 and ranks among the most densely populated cities in the country.
A family-friendly city like Redmond can prioritize the well-being and needs of families, creating an environment where children thrive, parents feel supported and families can enjoy a high quality of life together. Family-friendly cities are also known to foster a strong sense of community, with neighbors supporting and looking out for one another. These areas could also boast excellent educational opportunities, including high-quality schools, libraries and extracurricular activities. Access to quality education is essential for children's development and future success. By prioritizing the well-being of its residents, such cities become vibrant and resilient communities where families can truly flourish. In Redmond, 53% of families have kids under the age of 18 and 64% of residents over 15 years old are married. These demographics put this area in a position to reap the benefits of a family-friendly area.
Healthcare Planning: An analysis of Redmond demographics can inform healthcare planning and delivery by identifying population health needs, disparities and risk factors. Understanding demographic trends allows healthcare providers and policymakers to allocate resources effectively, develop prevention and intervention programs and address health inequities within communities. Leveraging demographic data, healthcare providers, and policymakers strive to achieve equitable, accessible, and high-quality healthcare for all individuals and communities. This proactive healthcare planning approach ensures targeted interventions, efficient resource allocation and customized healthcare services to meet the diverse needs of populations.
Social Cohesion: Reporting and analyzing demographics can play a crucial role in fostering social cohesion and understanding among diverse communities. By recognizing and appreciating differences in Redmond demographics, societies can promote inclusivity, diversity and social harmony, while addressing social disparities and promoting equal opportunities for all individuals. Racial demographics reflect the diversity of a population and contribute to fostering inclusive and welcoming communities. Embracing diversity strengthens social cohesion, promotes cultural understanding and enriches the fabric of society by celebrating the contributions of individuals from different racial and ethnic backgrounds.
Urban Development: By leveraging demographic data in Redmond, urban planners can tailor areas to meet the needs of any resident across housing, transportation and public services, all while fostering sustainability and elevating quality of life. Demographic changes can fuel gentrification and neighborhood transformation, whether in urban or rural settings. As neighborhoods attract newcomers with varying income levels and lifestyle preferences, property values may appreciate, potentially displacing established residents and reshaping the neighborhood's fabric. A nuanced understanding of population density, age distribution, household size and income levels is pivotal for guiding decisions on zoning, transportation infrastructure, housing development and public amenities. Utilizing the demographic data in planning and implementing affordable housing initiatives can help mitigate displacement risks and promote inclusive communities.
| Race | Redmond | Washington | National |
| White | 53.69% | 77.34% | 73.35% |
| Black | 1.66% | 3.63% | 12.63% |
| Asian | 36.78% | 7.80% | 5.22% |
| American Indian | 0.71% | 1.33% | 0.82% |
| Native Hawaiian | 0.23% | 0.63% | 0.18% |
| Mixed race | 5.39% | 5.34% | 3.06% |
| Other race | 1.54% | 3.92% | 4.75% |
 Here are the best places to live in Washington
 10 best cities to buy a new house in Washington
 10 Best cities in Washington for employment
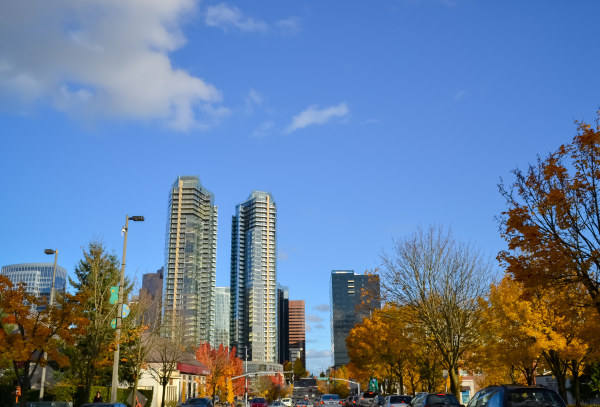 See the best places to live in & around Redmond