| Index | Oceanside | California | National |
| Median home price | $538,200 | $409,300 | $184,700 |
| Median rent asked | $1,803 | $1,297 | $949 |
| Avg. people per household | 2.9 | 3.0 | 2.6 |
| Owner occupied households | 57.1% | 54.1% | 63.6% |
| Renter occupied households | 42.9% | 45.9% | 36.4% |

| Population | Home Price | National Avg. | |
| Camp Pendleton North, CA | 7,885 | $0 | 100% |
| Camp Pendleton South, CA | 16,618 | $0 | 100% |
| Vista, CA | 100,659 | $503,500 | 173% |
| Rainbow, CA | 2,211 | $537,400 | 191% |
| Fallbrook, CA | 32,359 | $555,500 | 201% |
| Oceanside, CA | 175,694 | $538,200 | 191% |
| Population | Home Price | National Avg. | |
| Elk Grove, CA | 173,370 | $437,100 | 137% |
| Rancho Cucamonga, CA | 178,060 | $515,600 | 179% |
| Ontario, CA | 178,194 | $408,000 | 121% |
| Santa Rosa, CA | 178,391 | $571,600 | 209% |
| Garden Grove, CA | 172,800 | $580,300 | 214% |
| Oceanside, CA | 175,694 | $538,200 | 191% |
 Here are the best places to live in California
 Most Dangerous Cities In The US
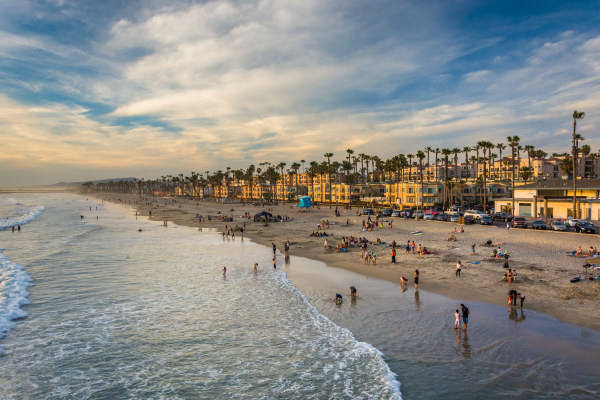 See the best places to live in Oceanside
 Safest Cities In The US