| Index | Carrollton | Texas | National |
| Median home price | $476,073 | $256,744 | $326,622 |
| Median rent asked | $1,940 | $1,363 | $1,444 |
| Avg. people per household | 2.7 | 2.8 | 2.6 |
| Owner occupied households | 59.7% | 61.9% | 63.6% |
| Renter occupied households | 40.3% | 38.1% | 36.4% |


| Population | Home Price | National Avg. | |
| Bristol, TX | 462 | $0 | 100% |
| Horseshoe Bend, TX | 641 | $152,183 | 53% |
| Lake Dallas, TX | 8,292 | $359,575 | 10% |
| Irving, TX | 248,458 | $360,509 | 10% |
| Farmers Branch, TX | 44,287 | $369,143 | 13% |
| Carrollton, TX | 142,475 | $476,073 | 46% |
| Population | Home Price | National Avg. | |
| Charleston, SC | 142,427 | $629,743 | 93% |
| Surprise, AZ | 142,589 | $470,443 | 44% |
| Waco, TX | 142,208 | $238,433 | 27% |
| Metairie, LA | 141,877 | $450,804 | 38% |
| Roseville, CA | 143,208 | $853,668 | 161% |
| Carrollton, TX | 142,475 | $476,073 | 46% |

 Here are the best places to live in Texas
 These are the 10 cheapest cities in Texas
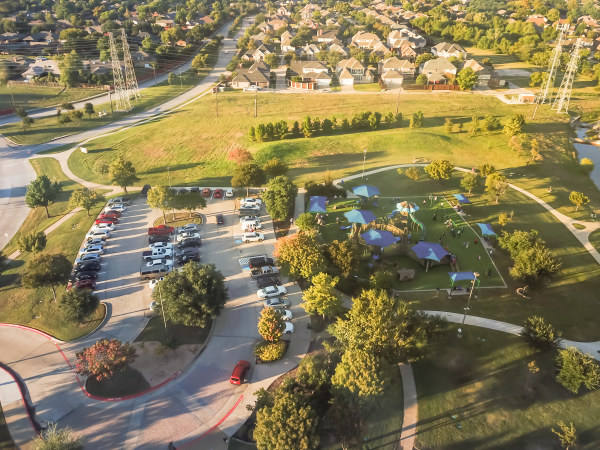 See the best places to live in Carrollton
 Most Dangerous States In The US