| Index | Auburn | Washington | National |
| Income per capita | $52,723 | $48,431 | $44,883 |
| Median household income | $114,418 | $91,816 | $81,333 |
| Median income owner occupied | $145,963 | $120,601 | $106,172 |
| Median income renter occupied | $82,546 | $60,275 | $52,080 |
| Median earnings male | $71,636 | $60,502 | $54,343 |
| Median earnings female | $51,409 | $39,812 | $38,439 |
| Unemployment rate | 3.3% | 4.5% | 4.9% |
| Poverty level | 9.2% | 12.7% | 15.1% |


| Labour Type | Male | Female |
| Construction industry | 16.2% | 16.2% |
| Manufacturing sector | 13.7% | 13.7% |
| Financial & insurance services | 2.1% | 2.1% |
| Wholesale & retail services | 17.1% | 17.1% |
| Public administration | 4.2% | 4.2% |
| Transportation, warehousing & utilities | 12.3% | 12.3% |
| Education, health & social services | 8.8% | 8.8% |
| Other | 24.1% | 24.1% |
| City | Population | Household Income | National Avg. |
| Mirrormont, WA | 4,225 | $195,265 | 140.1% |
| Shadow Lake, WA | 2,445 | $183,806 | 126.0% |
| Ravensdale, WA | 840 | $183,181 | 125.2% |
| Lake Holm, WA | 3,461 | $179,730 | 121.0% |
| Maple Valley, WA | 27,291 | $175,512 | 115.8% |
| Auburn, WA | 83,617 | $114,418 | 40.7% |
| City | Population | Household Income | National Avg. |
| Lynchburg, VA | 83,703 | $72,552 | 10.8% |
| Franklin, TN | 83,480 | $147,192 | 81.0% |
| San Ramon, CA | 83,423 | $247,469 | 204.3% |
| Brooklyn Park, MN | 83,324 | $109,999 | 35.2% |
| Silver Spring, MD | 83,266 | $133,391 | 64.0% |
| Auburn, WA | 83,617 | $114,418 | 40.7% |

 Here are the best places to live in Washington
 Safest States In The US
 Most Dangerous States In The US
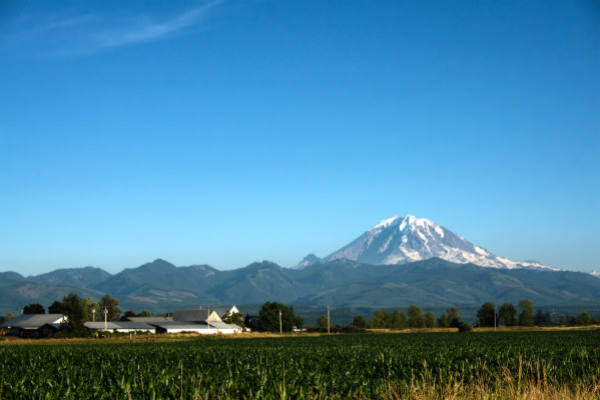 See the best places to live in Auburn