
Living in Washington, DC, known as 'The Nation's Capital,' offers a unique blend of historical significance, political importance, and vibrant urban living. Located on the east coast, Washington, DC is a large city that serves as the seat of the federal government of the United States. Major nearby cities like Baltimore and Arlington enhance its appeal as a central hub in the Mid-Atlantic region. Washington, DC's blend of historic landmarks, cultural festivals, and urban amenities creates a distinctive living experience.
Washington, DC is home to several iconic landmarks, including the White House, the Capitol Building, and the Washington Monument. The city offers a variety of attractions, from the Smithsonian Institution, which comprises numerous museums and galleries, to the National Mall, which is a central point for gatherings and events. Washington, DC's dining scene is diverse, offering everything from gourmet restaurants to casual eateries serving international cuisine.
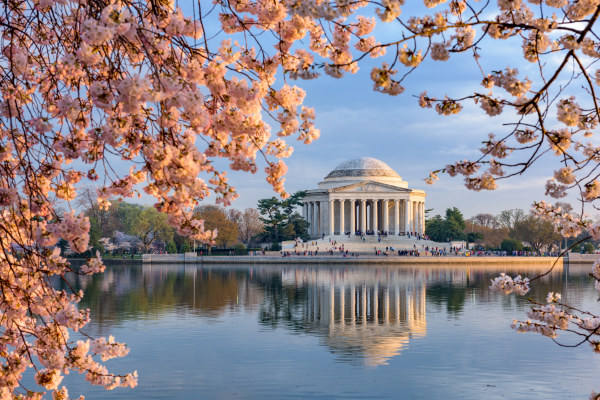
Annual events such as the National Cherry Blossom Festival and Independence Day celebrations on the National Mall highlight the city's vibrant cultural scene and provide unique entertainment opportunities for residents and visitors. These events celebrate Washington, DC's rich cultural heritage and community spirit. Prestigious institutions like Georgetown University and George Washington University contribute to the city's academic and cultural vibrancy, fostering a thriving intellectual community.
The arts and culture scene in Washington, DC is vibrant and diverse, with numerous theaters, music venues, and art galleries. The Kennedy Center for the Performing Arts and the National Gallery of Art are just a few of the cultural landmarks that showcase the city's commitment to the arts. Living in Washington, DC provides ample opportunities to engage with art, music, and history, making it an exciting place to call home.
Washington, DC’s community is welcoming and diverse, creating a friendly environment for newcomers. The city is home to professional sports teams like the Nationals (MLB) and the Capitals (NHL), providing plenty of excitement for sports fans. Major industries in Washington, DC include government, education, and healthcare, with significant employers such as the federal government and MedStar Health driving economic growth. The city has extensive public transit options, including the Metro system, buses, and bike-sharing programs, making it easy to navigate the city. Washington, DC experiences a humid subtropical climate, with hot summers and mild winters, making it a comfortable place to live year-round.
 Amenities
Conveniently located, the area boasts a variety of amenities, including grocery stores, shopping, coffee shops and entertainment options all within walking distance.
 Commute
The high commute score in this area could imply easy access to public transportation, as well as shorter-than-average commute times to your workplace.
 Employment
With higher than average median household income, income per capita and lower unemployment rates, this area scores extremely well in the employment category.
 Health & Safety
Accessible health facilities like hospitals, doctors offices, clinics and nursing homes as well as good air quality are all factors that have led to a high score in this category.
 Cost Of Living
This area is known for its high cost of living, which means you should anticipate higher costs for everyday goods and services, housing, groceries, and health care.
 Crime
Crime
Reporting high crime rates per 100,000 people, this area may be perceived as an unsafe place to reside. These statistics encompass both violent and property crime rates.
Washington is a large city located in the state of District of Columbia. The city has a population of 701,974 inhabitants. With a population density of 11,484 people per square mile, Washington is well above the nation's average density level. Washington is mostly populated by White (41%) and Black or African American (45%) ethnic groups. Single men and women might be happy to hear that in Washington, only 34% of the population is married. When traveling to work, spending unnecessary time in your vehicle is not ideal and downright frustrating. Across all of America, the average one way commute time is 26 minutes, unfortunately, living in Washington offers up a higher than average one way commute time of 31 minutes.
Whether you’re relocating to a new area to be closer to family, friends or for a new job, living in Washington could be a positive experience compared to other cities in District of Columbia if you know where to look. Don't forget to determine what matters most to you in a neighborhood. Consider factors such as safety, proximity to work or school, access to amenities (like parks, fitness facilities, grocery stores, restaurants), public transportation options, community atmosphere and the overall vibe you're looking for. To help you find the best places to live in and around Washington, AreaVibes has created a livability score using key metrics like amenities, crime, cost of living and more.
Using data and statistics Washington has received a livability score of 73 out of 100. This score is ranked in the 85th percentile when compared to all other cities. If we examine each of the categories individually, we see that Washington ranks well for employment (A+). Unfortunately for Washington, there are some categories for which it does not rank well, this includes: crime (F) and cost of living (F).
If you're living in Washington, you can expect to enjoy a multitude of local amenities, mostly thanks to the strategic placement of essential services such as grocery stores, restaurants, coffee shops, parks and various shops. If you're contemplating a move to this locale with the intent of establishing it as your permanent residence, you'll be pleased to find an extensive array of amenities and recreational opportunities within easy reach, either on foot or via a brief commute. This wealth of accessible amenities not only enhances the livability of the area but also ensures that you can enjoy a rich and fulfilling lifestyle, making Washington an attractive destination for those seeking a vibrant and well-served community to call home. Among the enticing options for fun and exploration in Washington are: Lincoln Memorial and Reflecting Pool, National Air and Space Museum, and Newseum.
Washington real estate prices and overall affordability will play a huge role in determining if the area is the right fit for you. Of course there are probably some other items on your “wish list”, but even before they are considered, let’s take a look at the home prices and affordability in Washington. Median real estate prices in Washington come in at $618,100, which is 22.1% higher than the District of Columbia average. The home price to income ratio compares the median home prices to the median household income. In Washington, the home price to income ratio is 6.8, which is 1.4% lower than the District of Columbia average.
| Statistic | Washington | District of Columbia | National |
| Average one way commute | 31min | 30min | 26min |
| Workers who drive to work | 32.1% | 33.7% | 76.4% |
| Workers who carpool | 4.9% | 5.4% | 9.3% |
| Workers who take public transit | 31.5% | 36.8% | 5.1% |
| Workers who bicycle | 4.2% | 4.3% | 0.6% |
| Workers who walk | 12.5% | 13.3% | 2.8% |
| Working from home | 12.3% | 5.2% | 4.6% |
 Here are the best places to live in District of Columbia
 Safest States In The US
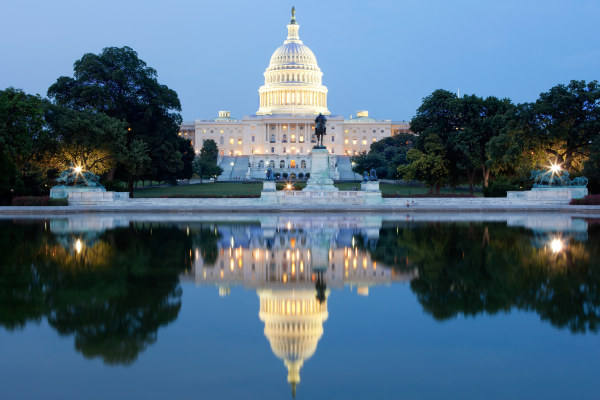 See the best places to live in Washington
 Check out the 10 most dangerous cities in District of Columbia