
Located in the state of Washington, Tumwater is a moderately-sized city with a population of 24,235 residents. If we look at the most recent Census, Tumwater is known to have a predominantly White population. The next two most common races are Black and Asian. Not a fan of sitting in traffic during your commute to work? Tumwater offers shorter work commutes, with an average one-way commute time taking only 20 minutes, far lower than the national average of 26 minutes.
If you’re considering moving to any new city, it could be a very discouraging task. However, it could also be a fulfilling experience if you are willing to get to know the area before actually living in Tumwater, Washington. When searching for a new neighborhood, several key items should be considered. Safety is of utmost importance, ensuring a secure environment with low crime. Proximity to your workplace or school helps reduce commuting time and offers convenience. Access to amenities such as parks, grocery stores, and healthcare facilities enhances your daily life. Public transportation options contribute to easy mobility. A sense of community fosters a supportive and engaging environment. Lastly, the overall atmosphere should align with your desired lifestyle, ensuring a fulfilling living experience. Considering these items will guide you towards finding the perfect neighborhood that fits all your needs. The best areas in Tumwater and in surrounding cities are easier to find when you are able to make informed decisions. Using data from cost of living, commute, health & safety, education, housing, you will see a detailed breakdown of the most important information as well as comparisons to the Washington and national averages.
Tumwater has a livability score of 84 out of 100 and is ranked #43 in Washington and #647 in the USA. Based on this score, Tumwater would be considered a very livable city! The cherry on top is that Tumwater also ranks in the top 10 percent of all cities. If we dig down a little deeper into each category within the livability score, we see that Tumwater has higher than average grades for the following: education (A-), employment (A-) and housing (A+). Regrettably for Tumwater, there are some categories for which it does not score well, this includes: amenities (D).
Feeling a sense of safety in the area that you live in is a must for most people. Low crime rates can have a positive impact on things like home prices, home appreciation rates and can help foster positive community dynamics and social cohesion. Tumwater has a violent crime rate of 196 crimes per 100,000 residents which is far lower than the national average.
Finding affordable real estate and housing in Tumwater can be tricky. Having said that, this area might be the place to get the best of both worlds. Based on factors like home/rental affordability and appreciation rates, this area has received an above average score in the housing category. A healthy real estate market can lead to wealth appreciation for property owners, as rising property values can contribute to homeowners' equity, financial stability and the ability to build long-term wealth.
Certain items on your wish list like shopping, restaurants, nightlife, parks and proximity to public transportation are all important things to look for. Having said that, perhaps the most important metric to consider when contemplating a move to Tumwater is real estate affordability. The median home price for Tumwater homes is $577,793, which is 17.5% higher than the Washington average. If we take a closer look at the affordability of homes in Tumwater, we’ll see that the home price to income ratio is 5, which is 7.4% lower than the Washington average.

| Statistic | Tumwater | Washington | National |
| Average one way commute | 20min | 27min | 26min |
| Workers who drive to work | 75.9% | 72.3% | 76.4% |
| Workers who carpool | 8.7% | 10.2% | 9.3% |
| Workers who take public transit | 2.1% | 6.2% | 5.1% |
| Workers who bicycle | 0.6% | 0.9% | 0.6% |
| Workers who walk | 2.6% | 3.6% | 2.8% |
| Working from home | 9.7% | 5.6% | 4.6% |

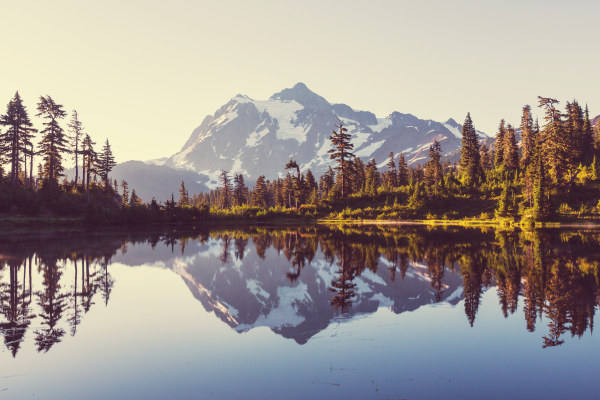 Here are the best places to live in Washington
 Most Dangerous States In The US
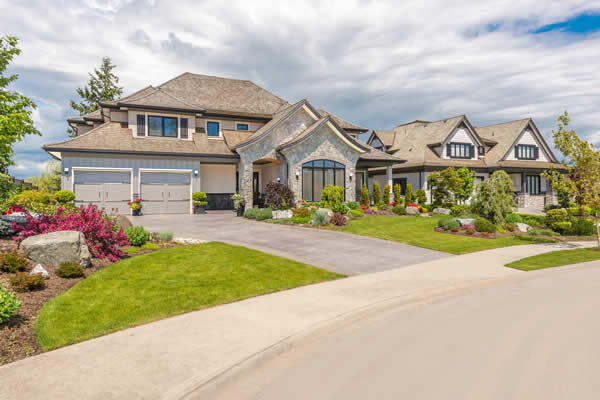 These are the 10 cheapest cities in Washington
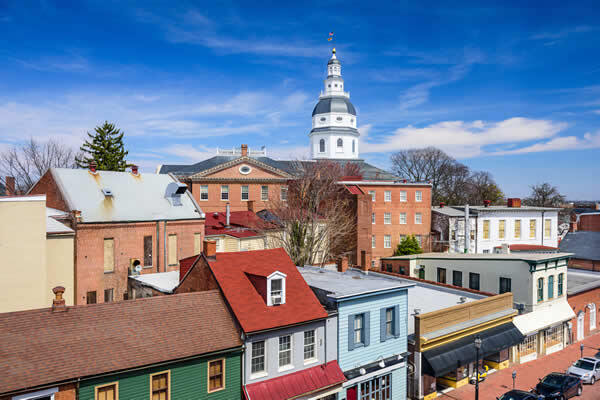 Safest States In The US