| Index | Magnolia Center | Riverside | California |
| Average Test Scores | 42% | 35% | 43% |
| Student/Teacher ratio | n/a | 23:1 | 20:1 |
| Total public schools | n/a | 90 | 8,308 |
| Total private schools | n/a | 40 | 3,438 |
| Total post-secondary schools | n/a | 12 | 1,085 |

| Index | Magnolia Center | Riverside | California |
| Completed 8th grade | 83.0% | 77.9% | 81.1% |
| Completed high school | 82.5% | 76.6% | 79.8% |
| Completed some college | 57.0% | 53.9% | 61.5% |
| Completed associate degree | 31.1% | 29.9% | 39.8% |
| Completed bachelors | 22.7% | 22.6% | 32.0% |
| Completed masters | 8.7% | 9.3% | 11.9% |
| Completed professional degree | 1.3% | 3.0% | 3.9% |
| Completed doctorate | 0.3% | 1.6% | 1.6% |

| City | Population | Avg. Test Scores | National Avg. |
| Eastvale, CA | 67,681 | 62% | 29.6% |
| Rancho Cucamonga, CA | 182,156 | 60% | 25.3% |
| Loma Linda, CA | 25,144 | 59% | 21.9% |
| Redlands, CA | 74,429 | 50% | 4.2% |
| Norco, CA | 27,611 | 48% | 0.9% |
| Riverside, CA | 334,324 | 35% | 26.3% |
| City | Population | Avg. Test Scores | National Avg. |
| Corpus Christi, TX | 338,491 | 47% | 2.7% |
| Lexington-Fayette, KY | 329,532 | 50% | 3.1% |
| Santa Ana, CA | 345,160 | 36% | 24.4% |
| Henderson, NV | 320,734 | 57% | 18.1% |
| Stockton, CA | 318,307 | 32% | 33.1% |
| Riverside, CA | 334,324 | 35% | 26.3% |

 Here are the best places to live in California
 Safest States In The US
 These are the largest cities in California
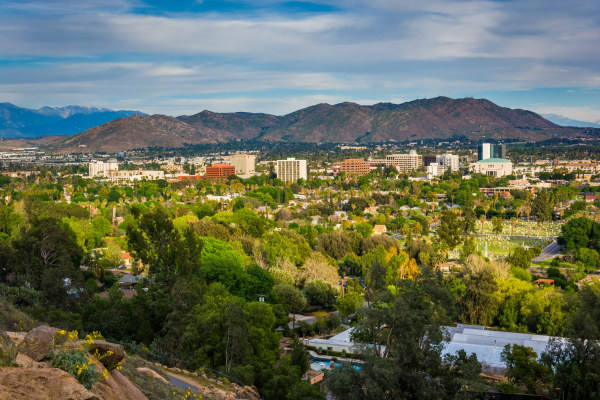 See the best places to live in Riverside