
Oakland, CA, known as 'The Bright Side of the Bay,' offers a unique blend of cultural diversity and urban amenities. Located in northern California, Oakland is a large city that serves as a major cultural and economic hub. Major nearby cities like San Francisco and Berkeley enhance its status as a central point in the region. Oakland's blend of historic landmarks, cultural festivals, and urban amenities creates a distinctive living experience.
Oakland is home to several iconic landmarks, including the Oakland Museum of California, the historic Paramount Theatre, and the picturesque Lake Merritt. The city offers a variety of attractions, from the beautiful Redwood Regional Park to the bustling Jack London Square, known for its dining and entertainment options. Oakland's dining scene is diverse, offering everything from soul food to international cuisine.
Annual events such as the Art + Soul Oakland Festival and the Oakland Greek Festival highlight the city's vibrant cultural scene and provide unique entertainment opportunities for residents and visitors. These events celebrate Oakland's rich cultural heritage and community spirit. Prestigious institutions like Mills College and California College of the Arts contribute to the city's academic and cultural vibrancy, fostering a thriving intellectual community.
The arts and culture scene in Oakland is dynamic and diverse, with numerous theaters, music venues, and art galleries. The Fox Theater and the Oakland Ballet are just a few of the cultural landmarks that showcase the city's commitment to the arts. Living in Oakland provides ample opportunities to engage with art, music, and history, making it an exciting place to call home.
Oakland’s community is welcoming and diverse, creating a friendly environment for newcomers. The city is home to professional sports teams like the Athletics (MLB) and the Raiders (NFL), providing plenty of excitement for sports fans. Major industries in Oakland include healthcare, technology, and education, with significant employers such as Kaiser Permanente and the Oakland Unified School District driving economic growth. The city has extensive public transit options, including buses and the BART system, making commuting convenient for residents.

Why stop at city-to-city? With Local Insights, you can compare neighborhoods, zip codes, or even exact addresses. Access 300+ hyperlocal data points—from schools and crime to housing and amenities—to see which area is the better fit.

| Statistic | Upper Rockridge | Oakland | California |
| Average one way commute | n/a | 33min | 28min |
| Workers who drive to work | 49.3% | 49.9% | 73.5% |
| Workers who carpool | 6.1% | 9.7% | 10.6% |
| Workers who take public transit | 19.7% | 21.5% | 5.2% |
| Workers who bicycle | 3.7% | 2.3% | 1.1% |
| Workers who walk | 2.2% | 3.6% | 2.7% |
| Working from home | 18.7% | 10.8% | 5.4% |

 Here are the best places to live in California
 Most Dangerous States In The US
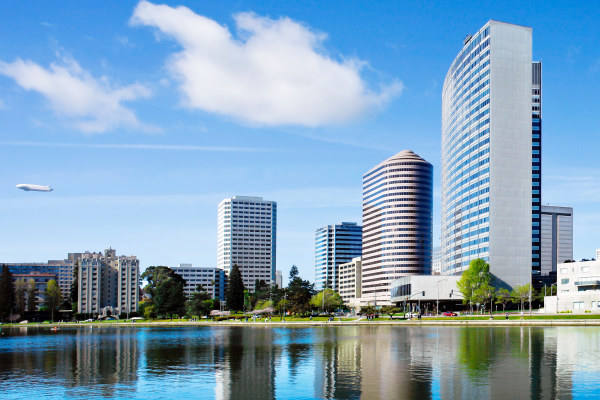 See the best places to live in Oakland
 Safest States In The US