| Month | Temp. (min) | Temp. (max) | Temp. (avg) | Precipitation |
| January | 41°F | 59°F | 50°F | 2.8" |
| February | 45°F | 62°F | 53°F | 3.1" |
| March | 47°F | 65°F | 55°F | 2.9" |
| April | 49°F | 67°F | 57°F | 1.8" |
| May | 52°F | 69°F | 59°F | 0.4" |
| June | 54°F | 72°F | 62°F | 0.3" |
| July | 56°F | 73°F | 63°F | 0.0" |
| August | 57°F | 73°F | 63°F | 0.0" |
| September | 55°F | 76°F | 64°F | 0.1" |
| October | 52°F | 73°F | 61°F | 1.0" |
| November | 47°F | 65°F | 56°F | 1.9" |
| December | 42°F | 59°F | 50°F | 4.1" |

| Index | Maxwell Park | Oakland | California |
| Air quality index | 40 | 40 | 55 |
| Pollution index | 19,202,400 | 19,202,400 | 10,473,190 |
| Measurement | Total |
| Days measured | 365 |
| Days with good air quality | 290 |
| Days with moderate air quality | 74 |
| Days w/ poor A.Q. for sensitive groups | 1 |
| Days with unhealthy air quality | 0 |
| Pollutant | Total |
| Arsenic | 0.180% |
| Benzene | 0.140% |
| Carbon Tetrachloride | 0.010% |
| Lead | 0.280% |
| Mercury | 0.060% |
| City | Population | Air Quality Index | National Avg. |
| Alamo, CA | 14,363 | 40 | 20.0% |
| Contra Costa Centre, CA | 6,854 | 40 | 20.0% |
| Pacheco, CA | 4,956 | 40 | 20.0% |
| San Miguel CDP (San Luis Obispo County), CA | 2,800 | 40 | 20.0% |
| Castro Valley, CA | 66,114 | 40 | 20.0% |
| Oakland, CA | 431,366 | 40 | 20.0% |
| City | Population | Air Quality Index | National Avg. |
| Minneapolis, MN | 439,880 | 46 | 8.0% |
| London, ON | 421,456 | n/a | |
| Laval, QC | 445,050 | n/a | |
| Tulsa, OK | 411,711 | 45 | 10.0% |
| Halifax, NS | 451,852 | n/a | |
| Oakland, CA | 431,366 | 40 | 20.0% |
 Here are the best places to live in California
 Most Dangerous States In The US
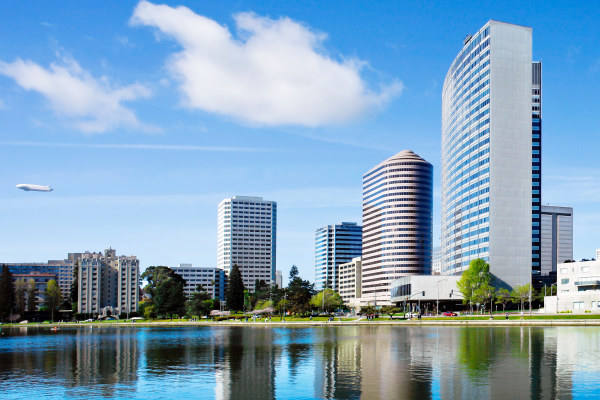 See the best places to live in Oakland
 Most Dangerous Cities In The US