

 Crime
Crime
This area is characterized by a crime rate, per 100,000 individuals, that falls well below the national average, indicating its potential as a very safe place to live.
 Employment
This area scores extremely well in the employment category. This is primarily due to the combination of low unemployment rates, higher median home income and income per capita.
 Ratings
Local residents have positive feedback regarding the convenience of amenities, parks, public transit, the friendliness of neighbors, the strong sense of community, and the overall safety of the area.
 Amenities
It appears that many amenities may not be conveniently situated within walking distance, potentially necessitating the use of a vehicle or public transit.
 Cost Of Living
Residents of this area contend with a high cost of living, resulting in increased expenditures for everyday goods and services, housing, utilities and health care.
 Health & Safety
Factors like poor air quality and the absence of essential health-related facilities like hospitals, clinics, nursing homes and pharmacies could have played a role in the low score in this category.
 Schools
Factors such as lower than average graduation rates, lackluster reading and math scores and the limited accessibility of local elementary and high schools could contribute to the low schools score.
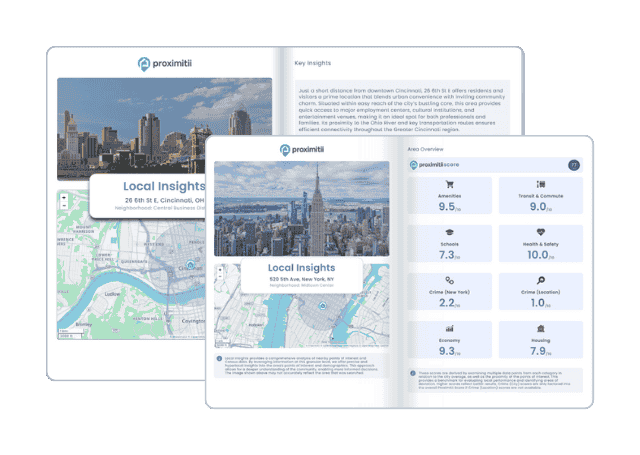
Why stop at city-to-city? With Local Insights, you can compare neighborhoods, zip codes, or even exact addresses. Access 300+ hyperlocal data points—from schools and crime to housing and amenities—to see which area is the better fit.

| Statistic | Knightsen | California | National |
| Average one way commute | 47min | 28min | 26min |
| Workers who drive to work | 74.8% | 73.5% | 76.4% |
| Workers who carpool | 8.9% | 10.6% | 9.3% |
| Workers who take public transit | 0.0% | 5.2% | 5.1% |
| Workers who bicycle | 0.0% | 1.1% | 0.6% |
| Workers who walk | 0.0% | 2.7% | 2.8% |
| Working from home | 10.7% | 5.4% | 4.6% |

 Here are the best places to live in California
 Check out the 10 safest cities in California
 These are the 10 cheapest cities in California
 Safest States In The US