

 Nothing Found
No pros were identified for this area. No categories met the specified threshold.
 Amenities
A large portion of amenities are not ideally situated within walking distance, potentially requiring residents to utilize a vehicle or public transportation.
 Commute
Access to public transportation in this particular area may be limited, which can result in longer-than-average commute times to reach workplaces.
 Crime
Crime
This area exhibits elevated crime rates per 100,000 residents, which may suggest it's a potentially unsafe place to reside. These rates encompass both property and violent crimes.
 Employment
Low income levels and high unemployment rates results in a low score in the employment category. It could prove difficult to find well-paying employment in this area.
 Schools
The lower than average schools score may be influenced by below-average education levels, subpar reading and math scores and the lack of access to local elementary and high schools.
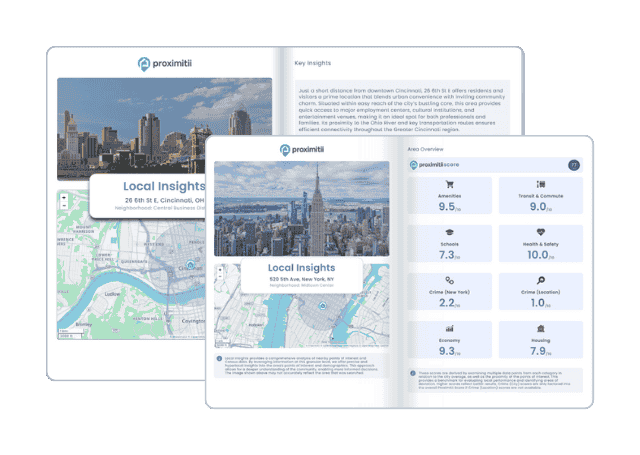
Why stop at city-to-city? With Local Insights, you can compare neighborhoods, zip codes, or even exact addresses. Access 300+ hyperlocal data points—from schools and crime to housing and amenities—to see which area is the better fit.

| Statistic | Happy Camp | California | National |
| Average one way commute | 9min | 28min | 26min |
| Workers who drive to work | 69.6% | 73.5% | 76.4% |
| Workers who carpool | 4.9% | 10.6% | 9.3% |
| Workers who take public transit | 0.4% | 5.2% | 5.1% |
| Workers who bicycle | 3.6% | 1.1% | 0.6% |
| Workers who walk | 12.9% | 2.7% | 2.8% |
| Working from home | 8.5% | 5.4% | 4.6% |

 Here are the best places to live in California
 Safest States In The US
 Most Dangerous Cities In The US
 See the best places to live in Happy Camp