
 Amenities
The area boasts an ample array of local amenities, such as restaurants, entertainment options, grocery stores and parks, all conveniently located within walking distance.
 Commute
A high commute score suggests convenient, easy access to public transportation, with shorter-than-average work commute times to work.
 Employment
This area excels in the employment category with a score well above average, primarily due to the higher median home income, per capita income and low unemployment rates.
 Housing
High scores in the housing category are attributed to this area, possibly pointing to a favorable home affordability ratio, robust appreciation rates or elevated home values.
 Schools
The schools category boasts a high score thanks to factors like excellent test scores, impressive graduation rates and the convenient placement of elementary and high schools in this area.
 Cost Of Living
The cost of living in this area is notably high, making it a more expensive place to live. You'll find higher expenses for everyday goods and services, housing and groceries.
Evanston is a moderately-sized city located in the state of Illinois. The city has a population of 75,477 people. Evanston has a population density of 9,702 people per square mile. This would be considered well above the national population density level. Single men and women might be happy to hear that in Evanston, only 47% of the population is married. Something to be aware of when living in Evanston are the above average commute times. If you're looking for a short commute to work, this might not be the right area for you. With one way commute time of 31 minutes, this comes in much higher than the national average of 26 minutes.
If you’re considering moving to any new city, it could be a very daunting task. However, it could also be a fulfilling experience if you are willing to get to know the area before actually living in Evanston, Illinois. When searching for a new neighborhood, several key items should be considered. Safety is of utmost importance, ensuring a secure environment with low crime. Proximity to your workplace or school helps reduce commuting time and offers convenience. Access to amenities such as parks, grocery stores, and healthcare facilities enhances your daily life. Public transportation options contribute to easy mobility. A sense of community fosters a supportive and engaging environment. Lastly, the overall atmosphere should align with your desired lifestyle, ensuring a fulfilling living experience. Considering these items will guide you towards finding the perfect neighborhood that fits all your needs. The best areas in Evanston and in surrounding cities are easier to find when you are able to make informed decisions. Using data from cost of living, health & safety, education, employment, housing, you will see a detailed breakdown of the most important information as well as comparisons to the Illinois and national averages.
With a livability score of 84/100, Evanston is ranked #536 in the United States and #20 in Illinois. Clearly, Evanston is doing something right, as this score ranks well above the average of most cities. The cherry on top is that Evanston also ranks in the top 10 percent of all cities. There are nine total categories that create the livability score. Evanston ranks well for crime (B-), education (A-), employment (A+) and housing (A-) On a more negative note, Evanston does not have favorable ranks for the following: cost of living (F). If we take a look at the data, we can find out why.
The mantra of real estate, "location, location, location," underscores the importance of where a property is situated, making it a pivotal factor in your quest for a new home. Fortunately, when you're living in Evanston, you'll discover an abundance of exceptional local amenities and lots of things to do. Among these are conveniently located grocery stores, charming coffee shops, diverse dining options and plenty of spacious parks. These local amenities contribute significantly to its overall appeal, ensuring that your daily needs are met and offering ample opportunities for leisure and recreation. When considering your next move, the thriving local scene in Evanston undoubtedly enhances its desirability, affirming the significance of its prime location. Some of the interesting things to do and attractions include: Northwestern University, Grosse Point Lighthouse, and Ryan Field.
Low rates of violent crime, encompassing offenses such as murder, rape, robbery and assault, contribute significantly to a safer living environment. This reduction in crime minimizes the chances of personal harm, property theft, or violent incidents. Furthermore, low crime rates can have a positive impact on property values and the overall desirability of an area. There were 142 crimes per 100,000 residents, which signifies that Evanston boasts an impressively low violent crime rate that falls well below the national average.
Real estate represents the most substantial investment for homebuyers, constituting their most valuable asset. Renters, on the other hand, typically see their monthly rent as their most significant expense. The Evanston market earns a high score in the housing category, surpassing the national average in factors like home and rental affordability and appreciation rates. This robust real estate market not only benefits individual homeowners and renters but also spurs vigorous local economic activity and job growth, solidifying its significance in driving the region's prosperity and financial well-being.
Being close to public transit, grocery stores, parks and other conveniences are all important when weighing your options for a new home in Evanston. Before you determine if any of these amenities are available in the area, you will also want to know if the real estate prices in Evanston are affordable. The median home price for Evanston homes is $742,841, which is 140.7% higher than the Illinois average. If we take a closer look at the affordability of homes in Evanston, we’ll see that the home price to income ratio is 6, which is 71.4% higher than the Illinois average.

| Statistic | Evanston | Illinois | National |
| Average one way commute | 31min | 29min | 26min |
| Workers who drive to work | 46.4% | 73.4% | 76.4% |
| Workers who carpool | 6.3% | 8.3% | 9.3% |
| Workers who take public transit | 19.4% | 9.2% | 5.1% |
| Workers who bicycle | 3.2% | 0.6% | 0.6% |
| Workers who walk | 9.1% | 3.1% | 2.8% |
| Working from home | 14.5% | 4.4% | 4.6% |

 Here are the best places to live in Illinois
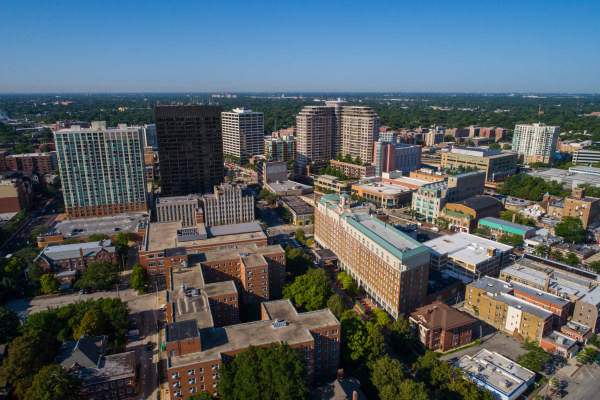 See the best places to live in Evanston
 Check out the 10 most dangerous cities in Illinois
 Check out the 10 safest cities in Illinois