

| Statistic | Burchard | Nebraska | National |
| Average one way commute | 35min | 18min | 26min |
| Workers who drive to work | 90.0% | 81.4% | 76.4% |
| Workers who carpool | 0.0% | 9.4% | 9.3% |
| Workers who take public transit | 0.0% | 0.7% | 5.1% |
| Workers who bicycle | 0.0% | 0.5% | 0.6% |
| Workers who walk | 5.0% | 2.8% | 2.8% |
| Working from home | 5.0% | 4.3% | 4.6% |
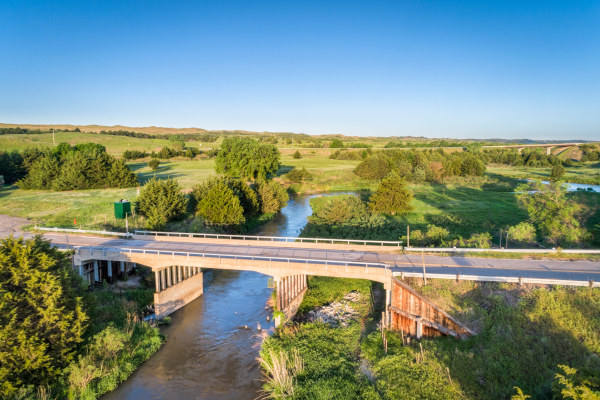 Here are the best places to live in Nebraska
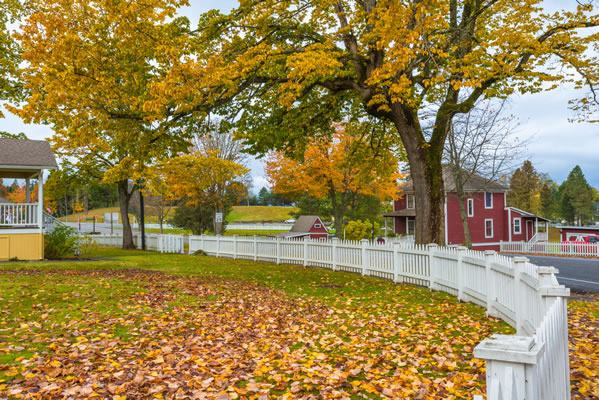 See the best places to live in Burchard
 Most Dangerous States In The US
 Check out the 10 most dangerous cities in Nebraska