| Statistic | Reportedincidents | /100k people | Brentwood/100k people | California/100k people | National/100k people |
| Total crime | 1,720 | n/a (estimate) | 2,632 | 2,564 | 2,119 |
| Murder | 0 | n/a | 0.0 | 4.5 | 5.0 |
| Rape | 20 | n/a | 30.6 | 36.6 | 37.5 |
| Robbery | 59 | n/a | 90.3 | 119.1 | 60.6 |
| Assault | 79 | n/a | 120.9 | 325.8 | 256.1 |
| Violent crime | 158 | n/a (estimate) | 242 | 486 | 359 |
| Burglary | 144 | n/a | 220.3 | 305.8 | 229.2 |
| Theft | 1,250 | n/a | 1,912.7 | 1,345.2 | 1,272.1 |
| Vehicle theft | 168 | n/a | 257.1 | 427.5 | 258.8 |
| Property crime | 1,562 | n/a (estimate) | 2,390 | 2,078 | 1,760 |

Looking at the most recent crime report, the crime rate in Brentwood is 24.2% higher than the national average. These crimes fall into two primary categories: violent and property. Violent crimes encompass murder, rape, robbery and assault, while property crimes involve theft, vehicle theft and burglary. In Brentwood, there were 158 reported violent crimes, equivalent to 242 per 100,000 individuals, 32.7% lower than the national average. Additionally, there were 1562 property crimes, amounting to 2390 per 100,000 residents, 35.8% higher than the U.S. average.
In the most recently reported crime year, Brentwood registered zero reported homicides. This statistic not only designates the area as an exemplar of security but also emanates a profound sense of safety within its community. A minimal incidence of severe violent crime not only fosters a strong sense of well-being among residents but also sets a commendable standard for other regions aiming to cultivate similarly safe surroundings.
AreaVibes surveyed 24 local residents in Brentwood to gauge the safety of the area. Based on the results, 54% of people answered that there was very little crime in Brentwood and that they felt very comfortable walking alone at night. Another 46% of people responded that there was far too much crime and they would be hesitant to walk the streets alone at night. Keep in mind that the opinions of residents may vary depending on which area they live in.
To get a feel for the safety of living in Brentwood, it's essential to analyze both the overall crime rate and the daily incident count. Brentwood presents a total crime rate that is 24% higher than the national average per 100,000 residents. Consequently, Brentwood experiences an average of 4.71 daily crimes, comprising 0.43 violent incidents and 4.28 property-related offenses. This evaluation offers a comprehensive understanding of the safety landscape, aiding individuals in making informed decisions when considering relocation.
Year-over-year crime rates in Brentwood has increased by 17.7% in the last reported crime report. Comparing crime rates from one year to another offers some insight into whether or not Brentwood is becoming a safer or more dangerous place to live. Crime rates are categorized by violent and property crime. Year-over-year violent crime has decreased by 6.5%, while property crime has increased by 20.9%. This analysis equips individuals with crucial information for making informed decisions about living in Brentwood.
Brentwood has a poverty rate that stands at 5.7, in contrast to the national average of 15.1. Historically, a direct correlation has been observed between poverty rates and crime stats. Higher poverty rates have led to higher crime rates, while lower poverty rates have led to a reduction in Brentwood crime rates. Income disparities and heightened poverty levels can serve as catalysts for elevated or reduced criminal activity, as individuals may or may not turn to illicit means to fulfill their basic needs. This could be one of many factors that may influence crime.
In Brentwood, 88.1% of residents have graduated from high school, whereas the national average stands at 83%. The educational makeup of a community can exert a significant influence on crime rates. Typically, higher levels of educational attainment are associated with reduced crime rates, as they furnish individuals with improved employment prospects and viable alternatives to engaging in criminal activities. Conversely, communities characterized by lower educational achievement often grapple with higher crime rates, as limited opportunities may drive individuals towards criminal behavior.
In Brentwood, the cost of living is 76.91% higher than the national average. A substantial cost of living can burden residents, particularly those with constrained financial means. When individuals contend with steep housing expenses, grocery bills, utility costs, healthcare and essential needs that strain their budgets, they may turn to criminal activities, such as theft or fraud, as a means of financial survival. Conversely, cities characterized by a more affordable cost of living may alleviate economic pressures, which could potentially lead to decreased crime rates.

| Item | Brentwood | California | National |
| Law enforcement employees (officers & civilians) | 74 | 51,506 | 558,732 |
| Police officers & civilians /1000 residents | 1.4 | 3.6 | 3.3 |
| State | Total offenders | California /100K | National /100K |
| California | 79,891 | 232 | 266 |
| City | Population | Violent crime/100k people | Property crime/100k people | Total crime/100k people |
| Knightsen, CA | 1,141 | 68 | 292 | 360 |
| Clayton, CA | 11,862 | 84 | 507 | 591 |
| Danville, CA | 46,118 | 63 | 584 | 647 |
| Byron, CA | 2,113 | 134 | 571 | 705 |
| Camino Tassajara, CA | 6,002 | 158 | 676 | 834 |
| Blackhawk, CA | 10,905 | 185 | 792 | 977 |
| Diablo, CA | 867 | 196 | 840 | 1,036 |
| Brentwood, CA | 65,405 | 242 | 2,390 | 2,632 |
| City | Population | Violent crime/100k people | Property crime/100k people | Total crime/100k people |
| Dublin, CA | 65,416 | 154 | 1,918 | 2,072 |
| Port Orange, FL | 65,435 | 259 | 1,379 | 1,638 |
| Haverhill, MA | 65,500 | 411 | 924 | 1,335 |
| Cheyenne, WY | 65,554 | 329 | 2,989 | 3,317 |
| Dundalk, MD | 65,241 | 657 | 3,208 | 3,866 |
| Brentwood, CA | 65,405 | 242 | 2,390 | 2,632 |

 Here are the best places to live in California
 Safest Cities In The US
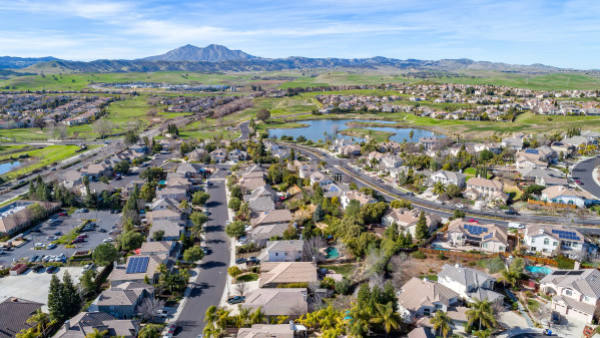 See the best places to live in Brentwood
 These are the largest cities in California