
Detroit, MI, known as 'The Motor City,' offers a unique blend of industrial history and cultural vibrancy. Located in southeastern Michigan, Detroit is a large city that played a significant role in the automotive industry. Major nearby cities like Ann Arbor and Windsor, Ontario enhance its status as a central hub in the Great Lakes region. Detroit's blend of historic landmarks, music heritage, and urban revitalization creates a distinctive living experience.
Detroit is home to several iconic landmarks, including the Detroit Institute of Arts, the historic Fox Theatre, and the Motown Museum. The city offers a variety of attractions, from the beautiful Belle Isle Park to the bustling Eastern Market, which features local vendors and fresh produce. Detroit's dining scene is diverse, offering everything from classic Coney Island hot dogs to innovative fusion cuisine.
Annual events such as the North American International Auto Show and the Detroit Jazz Festival highlight the city's dynamic cultural scene and provide unique entertainment opportunities for residents and visitors. These events celebrate Detroit's rich cultural heritage and community spirit. Prestigious institutions like Wayne State University and the University of Detroit Mercy contribute to the city's academic and cultural vibrancy, fostering a thriving intellectual community.
The arts and culture scene in Detroit is vibrant and diverse, with numerous theaters, music venues, and art galleries. The Detroit Symphony Orchestra and the Charles H. Wright Museum of African American History are just a few of the cultural landmarks that showcase the city's commitment to the arts. Living in Detroit provides ample opportunities to engage with art, music, and history, making it an exciting place to call home.
Detroit’s community is welcoming and diverse, creating a friendly environment for newcomers. The city is home to professional sports teams like the Lions (NFL) and the Tigers (MLB), providing plenty of excitement for sports fans. Major industries in Detroit include automotive, healthcare, and technology, with significant employers such as General Motors and Henry Ford Health System driving economic growth. The city has extensive public transit options, including buses and the QLINE streetcar, making it easy to navigate the city.
 Amenities
The area boasts an ample array of local amenities, such as restaurants, entertainment options, grocery stores and parks, all conveniently located within walking distance.
 Commute
A high commute score suggests convenient, easy access to public transportation, with shorter-than-average work commute times to work.
 Cost Of Living
The cost of living in this region is notably lower than the national average, encompassing everyday goods, housing, utilities, transportation and health care expenses.
 Housing
High scores in the housing category are attributed to this area, possibly pointing to a favorable home affordability ratio, robust appreciation rates or elevated home values.
 Crime
Crime
This area exhibits elevated crime rates per 100,000 residents, which may suggest it's a potentially unsafe place to reside. These rates encompass both property and violent crimes.
 Employment
Low income levels and high unemployment rates results in a low score in the employment category. It could prove difficult to find well-paying employment in this area.
 Schools
The lower than average schools score may be influenced by below-average education levels, subpar reading and math scores and the lack of access to local elementary and high schools.
 Ratings
Surveys and polls conducted by AreaVibes with residents of the area revealed unfavorable results concerning the walkability of amenities, the availability of parks and public transit access.
Located in the state of Michigan, Detroit is a large city with a population of 672,351 inhabitants. With a population density of 4,846 people per square mile, Detroit is well above the nation's average density level. In Detroit, the most common ethnic group is Black or African American with a total of 77%. This is followed by 14% White and 2% Asian ethnic groups. All the single ladies and all the single fellas might want to take notice as only 32% of the Detroit population is married. The average American spends about 26 minutes on their one way commute to work each day. Lower travel times can increase overall happiness and allow for more time to be spent with family and friends. While living in Detroit, your commute times will be about average, with a one way commute time of 26 minutes.
Whether you’re moving to a new area to be closer to family, friends or for a new job, living in Detroit could be a positive experience compared to other cities in Michigan if you know where to look. Don't forget to determine what matters most to you in a neighborhood. Consider factors such as safety, proximity to work or school, access to amenities (like parks, fitness facilities, grocery stores, restaurants), public transportation options, community atmosphere and the overall vibe you're looking for. Finding the best places to live in Detroit and nearby areas is a much easier task when you can rely on information and data from the livability score, which includes crime, commute, employment and other important metrics.
Using data and statistics Detroit has received a livability score of 73 out of 100. This score is ranked in the 85th percentile when compared to all other cities. Based on the rankings for each individual category, Detroit has received high marks for housing (A+). Unfortunately for Detroit, there are some categories for which it does not score well, this includes: crime (F), education (F) and employment (F).
If you're living in Detroit, you can expect to enjoy a multitude of local amenities, mostly thanks to the strategic placement of essential services such as grocery stores, restaurants, coffee shops, parks and various shops. If you're contemplating a move to this locale with the intent of establishing it as your permanent residence, you'll be pleased to find an extensive array of amenities and recreational opportunities within easy reach, either on foot or via a brief commute. This wealth of accessible amenities not only enhances the livability of the area but also ensures that you can enjoy a rich and fulfilling lifestyle, making Detroit an attractive destination for those seeking a vibrant and well-served community to call home. Here are some of the more popular things to do in Detroit: Comerica Park, Detroit Institute of Arts, and Detroit People Mover.
Real estate represents the most substantial investment for homebuyers, constituting their most valuable asset. Renters, on the other hand, typically see their monthly rent as their most significant expense. The Detroit market earns a high score in the housing category, surpassing the national average in factors like home and rental affordability and appreciation rates. This robust real estate market not only benefits individual homeowners and renters but also spurs vigorous local economic activity and job growth, solidifying its significance in driving the region's prosperity and financial well-being.
Detroit real estate prices and overall affordability will play a huge role in determining if the area is the right fit for you. Of course there are probably some other items on your “wish list”, but even before they are considered, let’s take a look at the home prices and affordability in Detroit. The median home price for Detroit homes is $52,700, which is 58.8% lower than the Michigan average. If we take a closer look at the affordability of homes in Detroit, we’ll see that the home price to income ratio is 1.6, which is 36% lower than the Michigan average.
| Statistic | Detroit | Michigan | National |
| Average one way commute | 26min | 24min | 26min |
| Workers who drive to work | 68.8% | 82.5% | 76.4% |
| Workers who carpool | 12.6% | 8.8% | 9.3% |
| Workers who take public transit | 6.6% | 1.4% | 5.1% |
| Workers who bicycle | 0.7% | 0.5% | 0.6% |
| Workers who walk | 3.6% | 2.2% | 2.8% |
| Working from home | 5.4% | 3.7% | 4.6% |
 Here are the best places to live in Michigan
 These are the largest cities in Michigan
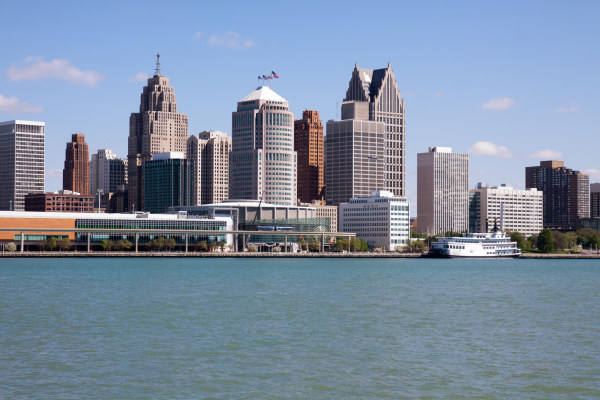 See the best places to live in Detroit
 These are the 10 cheapest cities in Michigan