| Index | Downtown Sarnia | Sarnia | Ontario |
| Median household income | $41,022 | $76,027 | $87,353 |
| Unemployment rate | 6.4% | 7.2% | 4.2% |
| In labour force | 40.3% | 54.8% | 61.7% |
| Labour Type | Percent |
| Construction industry | 1.2% |
| Manufacturing sector | 4.8% |
| Financial & insurance services | 0.6% |
| Wholesale & retail services | 4.8% |
| Public administration | 1.1% |
| Transportation, warehousing & utilities | 2.3% |
| Education, health & social services | 5.7% |
| Other | 16.9% |
| City | Population | Household Income | National Avg. |
| Plympton-Wyoming, ON | 8,517 | $107,882 | 30.9% |
| Enniskillen, ON | 2,704 | $104,095 | 26.3% |
| St. Clair, ON | 14,919 | $100,524 | 21.9% |
| Oil Springs, ON | 698 | $86,797 | 5.3% |
| Point Edward, ON | 2,173 | $85,726 | 4.0% |
| Sarnia, ON | 74,477 | $76,027 | 7.8% |
| City | Population | Household Income | National Avg. |
| Buckeye, AZ | 74,467 | n/a | |
| Rock Hill, SC | 74,410 | n/a | |
| Rancho Cordova, CA | 74,394 | n/a | |
| Rochester Hills, MI | 74,340 | n/a | |
| Bolingbrook, IL | 74,319 | n/a | |
| Sarnia, ON | 74,477 | $76,027 | 7.8% |
 Here are the best places to live in Ontario
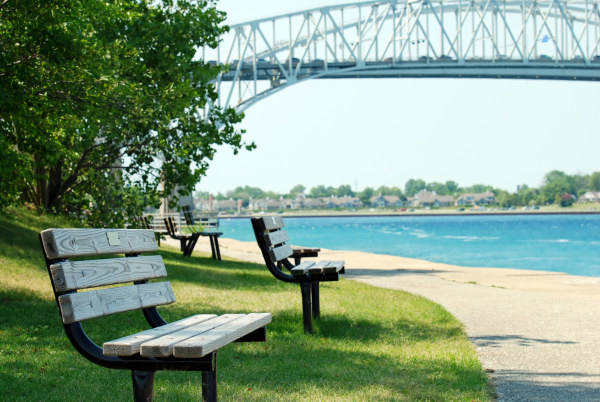 See the best places to live in & around Sarnia
 Top 10 best public schools in Sarnia
 10 best cities to buy a new house in Ontario