| Index | Kingsbridge | Niagara Falls | Ontario |
| Median home price | n/a | $616,200 | $821,624 |
| Median rent asked | n/a | $1,920 | $2,456 |
| Avg. people per household | 2.0 | 2.4 | 2.6 |
| Owner occupied households | 68.4% | 71.5% | 69.3% |
| Renter occupied households | 31.6% | 28.5% | 30.5% |
| Population | Home Price | National Avg. | |
| Fort Erie, ON | 32,970 | n/a | |
| Port Colborne, ON | 19,317 | n/a | |
| Pelham, ON | 18,077 | n/a | |
| Welland, ON | 56,929 | $507,000 | 23% |
| St. Catharines, ON | 140,913 | $609,000 | 8% |
| Niagara Falls, ON | 95,282 | $616,200 | 7% |
| Population | Home Price | National Avg. | |
| Chilliwack, BC | 95,663 | $705,900 | 7% |
| North Vancouver, BC | 94,662 | $1,449,000 | 120% |
| Cape Breton, NS | 94,573 | $207,100 | 69% |
| Brossard, QC | 96,033 | $468,000 | 29% |
| Pickering, ON | 96,267 | $988,000 | 50% |
| Niagara Falls, ON | 95,282 | $616,200 | 7% |
 Here are the best places to live in Ontario
 Top 10 best public schools in Niagara Falls
 Check out the 10 safest cities in Ontario
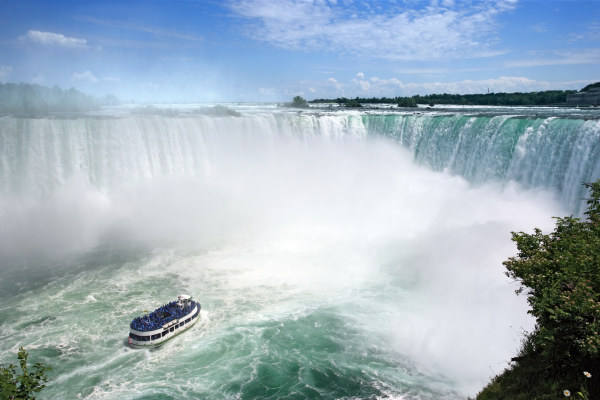 See the best places to live in & around Niagara Falls