| Statistic | Johns Creek | Georgia | National |
| Population | 87,090 | 10,962,807 | 336,919,644 |
| Population density (sq mi) | 2,826 | 191 | 91 |
| Median age | 41.6 | 36.2 | 37.7 |
| Male/Female ratio | 1.0:1 | 1.0:1 | 1.0:1 |
| Married (15yrs & older) | 68% | 54% | 55% |
| Families w/ Kids under 18 | 52% | 45% | 43% |
| Speak English | 64% | 86% | 79% |
| Speak Spanish | 5% | 8% | 13% |

The demographics of Johns Creek offer invaluable insights into the composition, dynamics and needs of both urban and rural areas, empowering planners, developers and policymakers to foster prosperity, equity, and well-being for all residents. With a population of 87,090, Johns Creek exhibits a population density of 2,826 people per square mile, contrasting with the national average of 91. The median age stands at 41.6, with 68% of individuals aged 15 or older being married and 52% having children under 18. In terms of income equality in Johns Creek, 6% of households report a median income below $25,000, while 51% report an income exceeding $150,000, showcasing a diverse economic landscape.
The 5 largest ethnic groups in Johns Creek are 57.8% White, 10% Black or African American, 25.5% Asian, 0.3% American Indian and 0% Native Hawaiian, with 7.5% of the population identifying as Hispanic or Latino. Of note, 63.8% of households reported speaking English only, while 5.4% reported speaking Spanish only. Additionally, 31% of residents were classified as foreign-born. The Johns Creek racial demographics and ethnicity breakdown are essential for comprehending and addressing systemic inequities, advancing social justice and inclusion and cultivating resilient communities.
The Johns Creek population density comes in at 2,826 people per square mile, which makes it one of the most densely populated areas in the country, far surpassing the national average of 91. Areas characterized by high population density often boast an abundance of amenities and services within close proximity, providing residents with convenient access to healthcare, education, cultural attractions, dining establishments, retail outlets and transportation options. This accessibility could potentially enhance residents' overall quality of life and well-being.
Johns Creek, as a family-friendly city, places a significant emphasis on the well-being and needs of families, fostering an environment where children thrive, parents feel supported and families can collectively enjoy a high quality of life. These cities are characterized by their strong sense of community, with neighbors actively supporting and looking out for one another. Additionally, they often offer exceptional educational opportunities, including top-quality schools, well-stocked libraries and diverse extracurricular activities. Access to quality education is essential for children's development and future success. By prioritizing the well-being of its residents, such cities become vibrant and resilient communities where families can truly flourish. In Johns Creek, 52% of families have children under the age of 18, and 68% of residents aged over 15 are married. These demographics position this area to reap the benefits of being a family-friendly locality.
Social Cohesion: The examination and interpretation of demographics are pivotal for nurturing social cohesion and promoting understanding among diverse communities. By acknowledging and honoring differences in Johns Creek demographics, societies can champion inclusivity, diversity and social cohesion while addressing social disparities and advocating for equitable opportunities. Racial demographics can potentially showcase the diversity of a population and are crucial for fostering inclusive and embracing communities. Embracing diversity fortifies social bonds, fosters cultural appreciation and enriches society by celebrating the contributions of individuals from diverse racial and ethnic backgrounds.
Healthcare Planning: The examination of Johns Creek demographics can potentially inform healthcare planning and delivery by identifying population health needs, disparities and risk factors. By comprehending demographic trends, healthcare providers and policymakers can allocate resources effectively, develop prevention and intervention programs, and address health inequities within communities. Through the utilization of demographic statistics, healthcare providers and policymakers aim to achieve equitable, accessible, and high-quality healthcare for all individuals and communities. This proactive healthcare planning approach ensures targeted interventions, efficient resource allocation and tailored healthcare services to meet the diverse needs of populations.
Policy Planning: At various levels of government and within organizations and businesses, demographic data and statistics serve as essential tools for guiding policy and decision-making processes. Through the examination and interpretation of Johns Creek demographic stats and data, policymakers, government officials, and organizational leaders can pinpoint areas requiring attention, allocate resources judiciously and design policies and initiatives tailored to the specific needs and preferences of distinct demographic segments. The utilization of Johns Creek demographic data plays a pivotal role in policy formulation by informing resource allocation, facilitating evidence-based decision-making, identifying key priorities, predicting future trends, assessing policy effectiveness, and advancing principles of equity and inclusivity. Through effective utilization of this data, policymakers can craft policies that are targeted, efficient, and responsive to the diverse needs of communities.
| Race | Johns Creek | Georgia | National |
| White | 57.77% | 59.80% | 73.35% |
| Black | 9.99% | 31.17% | 12.63% |
| Asian | 25.52% | 3.70% | 5.22% |
| American Indian | 0.34% | 0.29% | 0.82% |
| Native Hawaiian | 0.01% | 0.05% | 0.18% |
| Mixed race | 4.36% | 2.20% | 3.06% |
| Other race | 2.01% | 2.79% | 4.75% |


 Here are the best places to live in Georgia
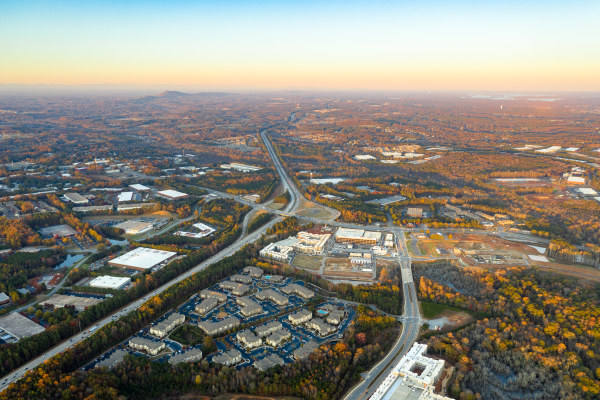 See the best places to live in Johns Creek
 Most Dangerous Cities In The US
 Most Dangerous States In The US