
Grand Prairie, TX, known as "The Grand City," offers a dynamic lifestyle with a rich cultural heritage. Located in the Dallas-Fort Worth metroplex, Grand Prairie is approximately 12 miles west of Dallas and 20 miles east of Fort Worth. This medium-sized city is known for its excellent recreational and entertainment options, making it a desirable place to live.
Grand Prairie's climate features hot, dry summers and mild winters, perfect for enjoying outdoor activities year-round. The city boasts numerous parks and recreational areas, such as Lynn Creek Park and Joe Pool Lake, which offer hiking trails, sports facilities, and picnic areas. The nearby Mountain Creek Lake provides additional opportunities for outdoor enthusiasts.
The cultural scene in Grand Prairie is diverse and dynamic, with attractions like the Uptown Theater, the Ripley's Believe It or Not! Museum, and the Verizon Theatre at Grand Prairie. The city hosts a variety of events and festivals throughout the year, including the Main Street Fest and the Prairie Lights holiday light display, which draw visitors and residents alike.
Education is a priority in Grand Prairie, with the Grand Prairie Independent School District offering quality education to its students. The city is also home to campuses of higher education institutions such as the University of Texas at Arlington and Dallas Baptist University. Additionally, Grand Prairie's proximity to major universities in Dallas and Fort Worth enhances its appeal as an educational hub.
Living in Grand Prairie combines the benefits of urban living with a strong sense of community. Residents enjoy access to top-notch healthcare facilities, diverse dining options, and a range of housing choices. The city's efficient public transportation system, including buses and the DART, makes commuting and exploring the area convenient. With its cultural richness, excellent amenities, and strategic location, Grand Prairie offers a fulfilling and dynamic living experience.
 Amenities
The area boasts an ample array of local amenities, such as restaurants, entertainment options, grocery stores and parks, all conveniently located within walking distance.
 Cost Of Living
The cost of living in this region is notably lower than the national average, encompassing everyday goods, housing, utilities, transportation and health care expenses.
 Housing
High scores in the housing category are attributed to this area, possibly pointing to a favorable home affordability ratio, robust appreciation rates or elevated home values.
 Health & Safety
Achieving a high health and safety score relies on factors including great air quality and convenient access to vital health facilities such as hospitals, doctors, clinics and police stations.
 Ratings
Locals express favorable opinions about the proximity of everyday local amenities, parks, public transit, neighborly atmosphere, strong sense of community and the general safety of the area.
 Commute
Access to public transportation in this particular area may be limited, which can result in longer-than-average commute times to reach workplaces.
Grand Prairie, Texas is a medium-sized city with a population of 198,327 residents. More than a quarter of the residents of Grand Prairie identify themselves as Hispanic or Latino, and 37% of the population speak Spanish as their primary or secondary language. Long commute times to work can be incredibly frustrating, ranking just behind housework on the list of life's annoyances. If you opt to make Grand Prairie your home, your one-way commute time will typically last around 29 minutes, a duration that aligns with the national average commute time of 26 minutes.
If you’re considering relocating to any new city, it could be a very daunting task. However, it could also be a great experience if you are willing to get to know the area before actually living in Grand Prairie, Texas. When searching for a new neighborhood, several key items should be considered. Safety is of utmost importance, ensuring a secure environment with low crime. Proximity to your workplace or school helps reduce commuting time and offers convenience. Access to amenities such as parks, grocery stores, and healthcare facilities enhances your daily life. Public transportation options contribute to easy mobility. A sense of community fosters a supportive and engaging environment. Lastly, the overall atmosphere should align with your desired lifestyle, ensuring a fulfilling living experience. Considering these items will guide you towards finding the perfect neighborhood that fits all your needs. Finding the best places to live in Grand Prairie and nearby areas is a much easier task when you can rely on information and data from the livability score, which includes crime, commute, employment, housing and other important metrics.
With a livability score of 79/100, Grand Prairie is ranked #1,687 in the United States and #42 in Texas. Compared to the US average, Grand Prairie ranks among some of the best places to live in the country! Grand Prairie has also earned the rare honor of ranking in the top 10 percentile among all cities. Based on the grades for each individual category, Grand Prairie has received high marks for amenities (A+), crime (B), cost of living (A+), employment (B) and housing (A+).
The mantra of real estate, "location, location, location," underscores the importance of where a property is situated, making it a pivotal factor in your quest for a new home. Fortunately, when you're living in Grand Prairie, you'll discover an abundance of exceptional local amenities and lots of things to do. Among these are conveniently located grocery stores, charming coffee shops, diverse dining options and plenty of spacious parks. These local amenities contribute significantly to its overall appeal, ensuring that your daily needs are met and offering ample opportunities for leisure and recreation. When considering your next move, the thriving local scene in Grand Prairie undoubtedly enhances its desirability, affirming the significance of its prime location. A few of the enjoyable things to experience and sights to see are: Lone Star Park Race Track, Louis Tussaud's Palace of Wax & Ripley's Believe It Or Not!, and Ripley's Believe it or Not.
Real estate represents the most substantial investment for homebuyers, constituting their most valuable asset. Renters, on the other hand, typically see their monthly rent as their most significant expense. The Grand Prairie market earns a high score in the housing category, surpassing the national average in factors like home and rental affordability and appreciation rates. This robust real estate market not only benefits individual homeowners and renters but also spurs vigorous local economic activity and job growth, solidifying its significance in driving the region's prosperity and financial well-being.
Assuming that Grand Prairie meets all of your requirements like low crime rates, good schools and great local amenities, the next most important item to examine is the affordability of real estate in Grand Prairie. Everything else becomes a lot less important if it turns out that home prices in Grand Prairie are simply unattainable. The median home price for Grand Prairie homes is $308,727, which is 20.2% higher than the Texas average. If we take a closer look at the affordability of homes in Grand Prairie, we’ll see that the home price to income ratio is 3, which is 6.3% lower than the Texas average.

| Statistic | Grand Prairie | Texas | National |
| Average one way commute | 29min | 26min | 26min |
| Workers who drive to work | 80.1% | 80.3% | 76.4% |
| Workers who carpool | 11.8% | 10.6% | 9.3% |
| Workers who take public transit | 0.3% | 1.5% | 5.1% |
| Workers who bicycle | 0.0% | 0.3% | 0.6% |
| Workers who walk | 0.7% | 1.6% | 2.8% |
| Working from home | 5.2% | 4.3% | 4.6% |

 Here are the best places to live in Texas
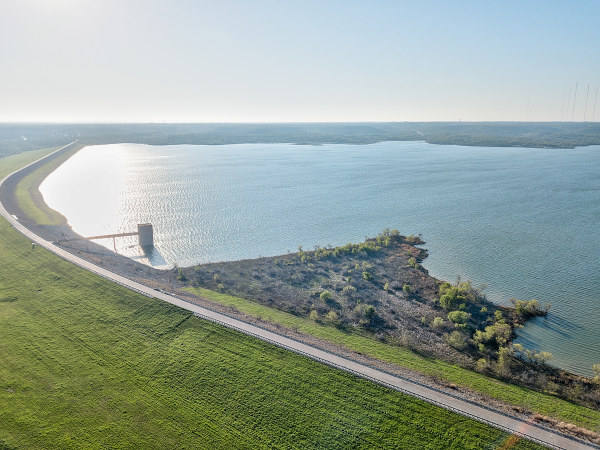 See the best places to live in Grand Prairie
 Most Dangerous Cities In The US
 Most Dangerous States In The US