| Index | Bergman/100k people | Edmonton/100k people | Alberta/100k people | National/100k people |
| Total crime | 7,336 (estimate) | 6,372 | 6,391 | 4,223 |
| Violent crime | 1,414 (estimate) | 1,228 | 1,232 | 1,042 |
| Property crime | 5,922 (estimate) | 5,144 | 5,159 | 3,181 |
| Statistic | Edmonton | Alberta | National |
| Total | -10.7% | -10.7% | -7.9% |
| Violent | -1.1% | -1.0% | -3.6% |
| Property | -14.2% | -13.7% | -9.8% |
| City | Population | Violent crime/100k people | Property crime/100k people | Total crime/100k people |
| Strathcona County, AB | 106,316 | 554 | 2,320 | 2,873 |
| St. Albert, AB | 73,103 | 727 | 3,047 | 3,774 |
| Strathcona County, AB | 106,316 | 792 | 3,318 | 4,110 |
| Stony Plain 135, AB | 2,110 | 888 | 3,720 | 4,609 |
| Fort Saskatchewan, AB | 28,368 | 1,029 | 4,309 | 5,338 |
| Edmonton, AB | 1,053,392 | 1,228 | 5,144 | 6,372 |
| City | Population | Violent crime/100k people | Property crime/100k people | Total crime/100k people |
| Ottawa, ON | 1,058,126 | 693 | 2,005 | 2,698 |
| Winnipeg, MB | 775,440 | 1,678 | 4,410 | 6,088 |
| Mississauga, ON | 764,342 | 484 | 1,400 | 1,884 |
| Brampton, ON | 735,754 | 759 | 2,199 | 2,958 |
| Calgary, AB | 1,371,990 | 811 | 3,395 | 4,206 |
| Edmonton, AB | 1,053,392 | 1,228 | 5,144 | 6,372 |
 Here are the best places to live in Alberta
 These are the 10 most affordable cities in Alberta
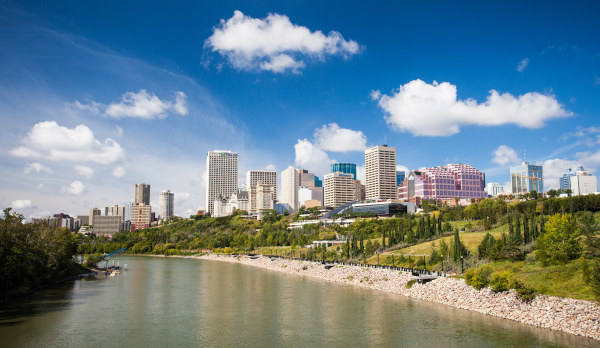 See the best places to live in & around Edmonton
 10 Best cities in Alberta for employment