Family friendlyPublic transit is accessibleWalkable to grocery storesYards are well-keptLots of parksWalkable to restaurantsFriendly neighbors Safe at night Pet friendly Streets have sidewalksA quiet areaSense of community
Source: The
Milcroft, Burlington, ON data and statistics displayed above are
derived from Statistics Canada and updated for 2021 by Environics Analytics.
 Here are the best places to live in Ontario
 10 Best cities in Ontario for employment
 These are the 10 most affordable cities in Ontario
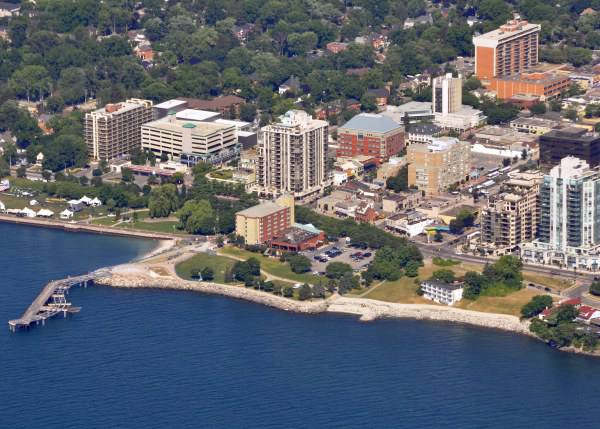 See the best places to live in & around Burlington