| Index | Aldershot East/100k people | Burlington/100k people | Ontario/100k people | National/100k people |
| Total crime | 1,468 (estimate) | 2,776 (estimate) | 3,086 | 4,223 |
| Violent crime | 377 (estimate) | 713 (estimate) | 792 | 1,042 |
| Property crime | 1,091 (estimate) | 2,064 (estimate) | 2,294 | 3,181 |
| Statistic | Burlington | Ontario | National |
| Total | n/a | -8.7% | -7.9% |
| Violent | n/a | -7.9% | -3.6% |
| Property | n/a | -9.1% | -9.8% |
| City | Population | Violent crime/100k people | Property crime/100k people | Total crime/100k people |
| Hamilton, ON | 11,739 | 250 | 723 | 973 |
| Oakville, ON | 212,353 | 472 | 1,366 | 1,838 |
| Milton, ON | 142,128 | 559 | 1,618 | 2,177 |
| Grimsby, ON | 31,320 | 606 | 1,757 | 2,363 |
| Hamilton, ON | 11,739 | 889 | 2,573 | 3,462 |
| Burlington, ON | 197,435 | 713 | 2,064 | 2,776 |
| City | Population | Violent crime/100k people | Property crime/100k people | Total crime/100k people |
| Oakville, ON | 212,353 | 472 | 1,366 | 1,838 |
| Richmond Hill, ON | 215,407 | 605 | 1,753 | 2,358 |
| Oshawa, ON | 176,009 | 581 | 1,682 | 2,263 |
| Richmond, BC | 222,489 | 1,028 | 4,513 | 5,540 |
| Sherbrooke, QC | 170,686 | 825 | 1,608 | 2,433 |
| Burlington, ON | 197,435 | 713 | 2,064 | 2,776 |
 Here are the best places to live in Ontario
 These are the 10 most affordable cities in Ontario
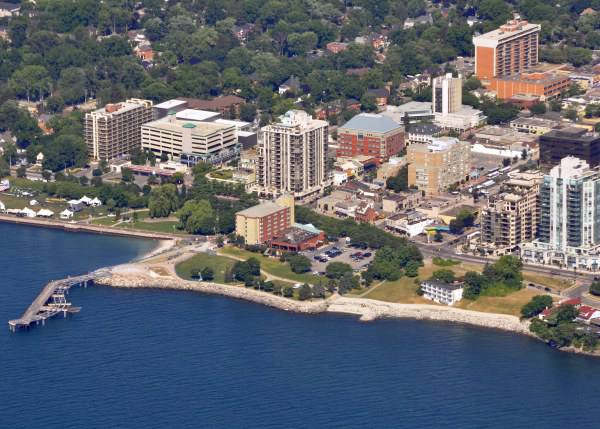 See the best places to live in & around Burlington
 10 best cities to buy a new house in Ontario