
| Index | Bearcreek | Montana | National |
| Median home price | $310,808 | $364,175 | $326,622 |
| Median rent asked | $1,586 | $1,111 | $1,444 |
| Avg. people per household | 3.1 | 2.4 | 2.6 |
| Owner occupied households | 61.7% | 67.2% | 63.6% |
| Renter occupied households | 38.3% | 32.8% | 36.4% |

| Population | Home Price | National Avg. | |
| Bridger CDP, MT | 20 | $0 | 100% |
| Belfry, MT | 313 | $149,582 | 54% |
| Bridger, MT | 941 | $264,660 | 19% |
| Roberts, MT | 307 | $344,925 | 6% |
| Red Lodge, MT | 2,184 | $507,414 | 55% |
| Bearcreek, MT | 147 | $310,808 | 5% |
| Population | Home Price | National Avg. | |
| Rye, AR | 147 | $163,242 | 50% |
| West Point, AR | 147 | $128,648 | 61% |
| Rohrsburg, PA | 147 | $210,626 | 36% |
| Hardinsburg, IN | 147 | $143,740 | 56% |
| Benson, PA | 147 | $140,894 | 57% |
| Bearcreek, MT | 147 | $310,808 | 5% |
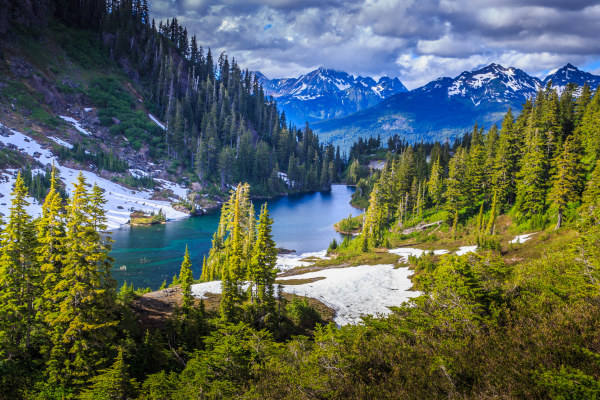 Here are the best places to live in Montana
 These are the largest cities in Montana
 Most Dangerous Cities In The US
 Most Dangerous States In The US