

 Commute
A high commute score suggests convenient, easy access to public transportation, with shorter-than-average work commute times to work.
 Ratings
Locals express favorable opinions about the proximity of everyday local amenities, parks, public transit, neighborly atmosphere, strong sense of community and the general safety of the area.
 Amenities
A large portion of amenities are not ideally situated within walking distance, potentially requiring residents to utilize a vehicle or public transportation.
 Cost Of Living
The cost of living in this area is notably high, making it a more expensive place to live. You'll find higher expenses for everyday goods and services, housing and groceries.
 Crime
Crime
This area exhibits elevated crime rates per 100,000 residents, which may suggest it's a potentially unsafe place to reside. These rates encompass both property and violent crimes.
 Schools
The lower than average schools score may be influenced by below-average education levels, subpar reading and math scores and the lack of access to local elementary and high schools.
Located in the state of California, Huntington Park is a mid-sized city with a population of 57,761 people. Huntington Park has a population density of 19,203 people per square mile. This would be considered well above the national population density level. More than a quarter of the residents of Huntington Park identify themselves as Hispanic or Latino, and 91% of the population speak Spanish as their primary or secondary language. Huntington Park tends to attract a younger crowd, as the median age of 32 is far below the national average. In Huntington Park, only 43% of people over the age of fifteen are married. This city could be a good option for singles ready to mingle. An important consideration when living in Huntington Park is the longer-than-average commute times. If you seek a short work commute, this area may not be the best choice for you. The one-way commute time here typically takes 32 minutes, far surpassing the national average of 26 minutes.
Whether you’re relocating to a new area to be closer to family, friends or for a new job, living in Huntington Park could be a positive experience compared to other cities in California if you know where to search. Don't forget to determine what matters most to you in a neighborhood. Consider factors such as safety, proximity to work or school, access to amenities (like parks, fitness facilities, grocery stores, restaurants), public transportation options, community atmosphere and the overall vibe you're looking for. To help you find the best places to live in and around Huntington Park, AreaVibes has created a livability score using key metrics like amenities, crime, education, employment, housing and more.
Huntington Park, CA receives 66/100 for its livability score; this results in a ranking of #363 in California and #10,138 in the USA. If we dig a little deeper into each category within the livability score, we see that Huntington Park has higher than average scores for the following: education (B). There is at least one category that does not have great scores in Huntington Park. The following was graded with a discouraging score: amenities (D-), crime (F) and cost of living (F).
There are many factors that go into deciding if an area is the right fit for your lifestyle. Certain “must haves” like low crime, great schools and nearby amenities are all at the top of most people's lists. But before even considering if those options are attainable, we'll need to know if the real estate in Huntington Park is actually affordable. The median home price for Huntington Park homes is $426,700, which is 4.3% higher than the California average. If we take a closer look at the affordability of homes in Huntington Park, we’ll see that the home price to income ratio is 9.1, which is 42.2% higher than the California average.
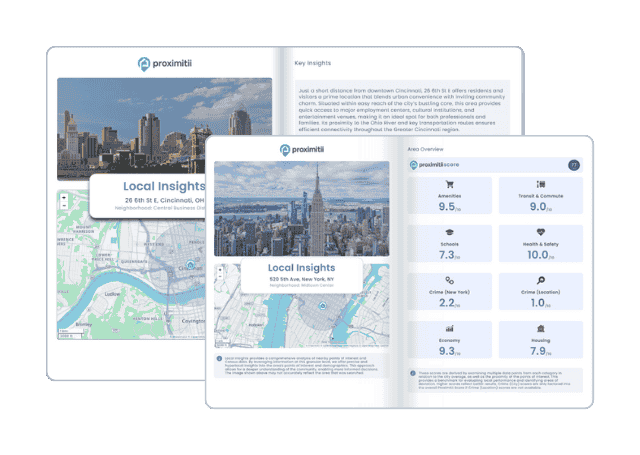
Why stop at city-to-city? With Local Insights, you can compare neighborhoods, zip codes, or even exact addresses. Access 300+ hyperlocal data points—from schools and crime to housing and amenities—to see which area is the better fit.

| Statistic | Huntington Park | California | National |
| Average one way commute | 32min | 28min | 26min |
| Workers who drive to work | 65.3% | 73.5% | 76.4% |
| Workers who carpool | 14.0% | 10.6% | 9.3% |
| Workers who take public transit | 7.9% | 5.2% | 5.1% |
| Workers who bicycle | 0.9% | 1.1% | 0.6% |
| Workers who walk | 4.7% | 2.7% | 2.8% |
| Working from home | 5.0% | 5.4% | 4.6% |

 Here are the best places to live in California
 Safest States In The US
 Most Dangerous States In The US
 See the best places to live in Huntington Park