| Statistic | Reportedincidents | /100k people | Pomona/100k people | California/100k people | National/100k people |
| Total crime | 5,253 | n/a (estimate) | 3,608 | 2,843 | 2,324 |
| Murder | 14 | n/a | 9.6 | 5.7 | 6.3 |
| Rape | 81 | n/a | 55.6 | 37.4 | 40.0 |
| Robbery | 244 | n/a | 167.6 | 123.5 | 66.1 |
| Assault | 521 | n/a | 357.8 | 332.8 | 268.2 |
| Violent crime | 860 | n/a (estimate) | 591 | 500 | 370 |
| Burglary | 774 | n/a | 531.6 | 371.9 | 269.8 |
| Theft | 2,640 | n/a | 1,813.2 | 1,499.3 | 1,401.9 |
| Vehicle theft | 979 | n/a | 672.4 | 471.9 | 282.7 |
| Property crime | 4,393 | n/a (estimate) | 3,017 | 2,343 | 1,954 |
The Pomona crime rates are 55.2% higher than the national average. There are two main categories of crime - violent crime and property crime. Violent crime consists of murder, rape, robbery and assault, while property crimes include burglary, theft and vehicle theft. There were a total of 860 violent crimes in Pomona (591 per 100,000 people), which is 59.7% higher than the national average and there were a total of 4393 property crimes (3017 per 100,000 residents) which is 54.4% higher than average.
Recently, vehicle thefts have seen an upward trend across the United States, and Pomona ranks among the cities with the highest vehicle theft rates in the country. Last year, there were 979 vehicle thefts, amounting to 672 stolen vehicles per 100,000 residents. This places Pomona within the worst 10% of all cities, indicating that 90% of cities fare better in terms of vehicle theft rates. The likelihood of your vehicle being stolen stands at 1 in 149.
AreaVibes conducted surveys inquiring about the safety perception of Pomona residents. Out of the respondents (105 in total), 34% expressed a strong sense of security, believing that crime rates in Pomona were low, and they felt comfortable walking alone at night. Conversely, 66% held a contrasting viewpoint, expressing concerns about safety in the area and feeling uncomfortable walking alone during the nighttime hours.
To determine if Pomona is a safe place to live, let's take a look at the overall crime rate of the area, as well as the number of daily crimes. Pomona has a total crime rate that is 55% higher than the national average per 100,000 residents. This results in a total of 14.39 daily crimes (2.36 violent daily crimes and 12.04 daily property crimes) in Pomona.
Year-over-year crime data allows us to analyze short-term trends in crime activity. By comparing crime rates from one year to the next, we can identify patterns and shifts in Pomona crime rates. This information can be invaluable for residents looking to make informed decisions on where to live. When comparing the most recent year to the previous year, total crime in Pomona has decreased by 5.2% year over year. Violent crime has increased by 10.3% and property crime has decreased by 7.7%.
In Pomona, the ratio of police officers and civilians stands at 1.7 per 1,000 residents, contrasting with the national average of 3.25. This discrepancy highlights the potential impact of law enforcement and community policing on crime rates. The strength of their collaboration can serve as a deterrent to criminal behavior, fostering a safer environment. Effective law enforcement leans heavily on community policing strategies that prioritize the cultivation of trust and cooperation between police and residents. It's essential to recognize that the effectiveness of these efforts isn't solely tied to the quantity of officers but also hinges on the quality of their engagement with the community.
The quality of housing and neighborhood conditions can influence crime rates. Neglected or run-down neighborhoods with poorly maintained properties may be more susceptible to criminal activities. In areas with housing affordability challenges, crime can emerge as a prominent issue. Certain individuals and families may find themselves residing in cramped or inadequate housing settings, amplifying stress levels and potentially fostering domestic conflicts and associated criminal incidents. It's worth noting that the median home price in Pomona stands at $420,600, a contrast to the national average of $184,700.
High rent costs can create economic stress for individuals and families, particularly those with limited financial resources. When a significant portion of one's income is spent on housing, there may be less money available for other essential needs such as food, healthcare and education. Economic stress can contribute to desperation and potentially lead individuals to engage in criminal activities, such as theft or fraud, as a means of financial survival. Average rent rates in Pomona are $1,406, compared to a national average of $949 per month.
| Item | Pomona | California | National |
| Law enforcement employees (officers & civilians) | 257 | 51,506 | 558,732 |
| Police officers & civilians /1000 residents | 1.7 | 3.6 | 3.3 |
| State | Total offenders | California /100K | National /100K |
| California | 79,891 | 232 | 266 |
| City | Population | Violent crime/100k people | Property crime/100k people | Total crime/100k people |
| San Antonio Heights, CA | 3,113 | 95 | 446 | 542 |
| Bradbury, CA | 825 | 0 | 1,025 | 1,025 |
| Yorba Linda, CA | 68,103 | 53 | 996 | 1,050 |
| La Habra Heights, CA | 5,318 | 55 | 1,049 | 1,104 |
| Lytle Creek, CA | 656 | 224 | 1,052 | 1,276 |
| La Puente, CA | 39,780 | 317 | 1,182 | 1,499 |
| Coronita, CA | 3,968 | 270 | 1,267 | 1,538 |
| Pomona, CA | 151,124 | 591 | 3,017 | 3,608 |
| City | Population | Violent crime/100k people | Property crime/100k people | Total crime/100k people |
| Escondido, CA | 150,396 | 345 | 1,795 | 2,140 |
| Pasadena, TX | 152,537 | 627 | 2,802 | 3,429 |
| Sunnyvale, CA | 152,569 | 219 | 2,457 | 2,676 |
| Kansas City, KS | 153,014 | 642 | 3,079 | 3,721 |
| Macon-Bibb County, GA | 153,026 | 595 | 2,740 | 3,334 |
| Pomona, CA | 151,124 | 591 | 3,017 | 3,608 |
 Here are the best places to live in California
 Top 10 cities in California with the best education system
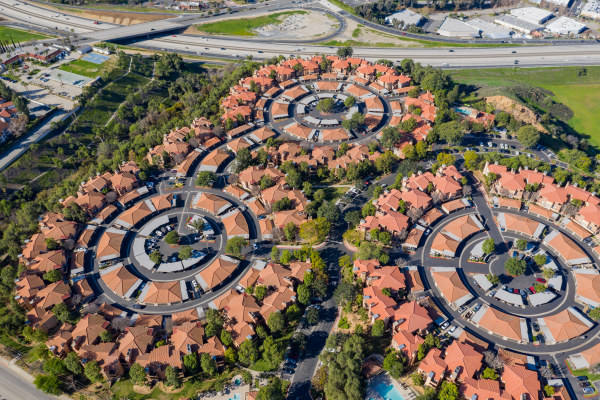 See the best places to live in & around Pomona
 Top 10 best public schools in Pomona