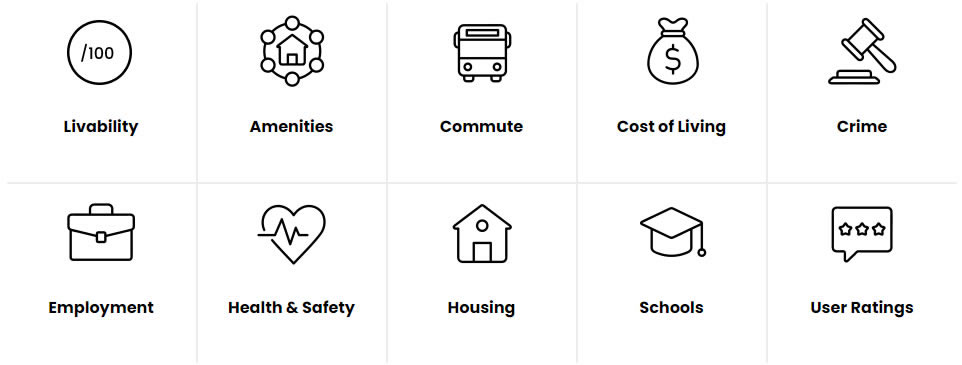
The Livability Score is a score out of 100 that was designed to help people quickly and easily evaluate the quality of an area. The score consists of 9 different categories and dozens of data points across multiple data sets.
Ranking more than 45,000 cities, neighborhoods and addresses isn’t easy; some might even say it’s impossible. Our Livability Score is created from science, data and statistics. Although we are unable to capture the smell of your favorite old school diner or the relationships that you’ve created with your friendly neighbors, we have done our best to create an overall score that reflects the things that we believe make an area a great place to live.
Each category (amenities, commute, cost of living, crime, employment, health & safety, housing, schools and user ratings) is scored individually based on data in the methodology below. A letter grade is assigned to each category in order to easily evaluate the score.
The amenities score provides an overview of the availability of local amenities in close proximity to an area. The algorithm searches for all amenities in the categories below within a 2 mile/3km (30 minute walk) radius to the center point of a location. Higher scores are awarded to the areas with the most nearby amenities from each of the following categories.
Source(s):
OpenStreetMap
The commute score provides an overview of the availability of local public transportation as well as the average commute times to work. The commute score is based on the accessability to nearby public transit stops, average commute times to work and the percentage of people who take public transit to work. The overall score is calculated based on comparison to the national average.
Source(s):
2021 United States Census Bureau American Community Survey
Environics Analytics
OpenStreetMap
The cost of living score provides an overview of the affordability of an area. The score takes into account the overall cost of living index (goods and services, housing, groceries, utilities, transportation and health care) as well as the state/provincial sales tax and income tax rates. The overall score is calculated based on comparison to the national average.
Overall cost of living index (85% of the cost of living score).
State/Provincial Sales Tax and State/Provincial Income Tax (15% of the cost of living score).
Source(s):
C2ER
United States Government
Statistics Canada
The crime score provides an overview of the overall safety of an area. The score takes into account both violent crime (murder, rape, robbery, assault) and property crime (burglary, theft, vehicle theft). Higher weights are given to violent crimes as they are more severe. For comparison purposes, crime rates are normalized per 100,000 residents. The overall score is calculated based on comparison to the national average.
Source(s):
FBI Uniform Crime Report
Statistics Canada
The employment score provides an overview of the economic strength of an area and availability of jobs within that area. A small portion of the score also takes into account the availability of public transportation in the area. The overall score is calculated based on comparison to the national average.
Source(s):
2021 United States Census Bureau American Community Survey
Statistics Canada
Environics Analytics
The health & safety score provides an overview of the air quality and the availability of health and safety facilities nearby. The health & safety score is based on the median air quality and the accessability to facilities such as hospitals, clinics, doctors, pharmacies, dentists, nursing homes, police and fire stations. The overall score is calculated based on comparison to the national average.
Source(s):
epa.gov
OpenStreetMap
The housing score provides an overview of the affordability, home values and appreciation rates of an area. Housing affordability measures the median home and rent price to household income ratio, lower ratios will receive higher scores. Home appreciation rates and median home price (higher home prices receive higher scores) complete the rest of the score. The overall score is calculated based on comparison to the national average.
Source(s):
2021 United States Census Bureau American Community Survey
Statistics Canada
Environics Analytics
The schools score provides an overview of the quality and level of public education in an area. The schools score is based on school test scores, the education level achieved and the proximity to elementary and high schools. Higher scores are awarded for higher average test scores, higher education levels achieved and schools that are nearby in proximity. The overall score is calculated based on comparison to the national average.
Source(s):
2021 United States Census Bureau American Community Survey
National Center for Education Statistics
The user ratings score provides insight from local residents who have submitted ratings and reviews on AreaVibes. Ratings and reviews take into account various factors including: proximity of restaurants and grocery stores, public transit accessibility, sense of community, friendliness of neighbors, overall safety, the number of parks nearby as well as various other metrics that factor into the overall livability of the area.
Source(s):
AreaVibes