Deep disparities mark the fortunes of American cities. Some metropolises enjoy an influx of eager millennials; others find residents flocking elsewhere in search of opportunity. Once-thriving cities continue to crumble, while some towns experience unprecedented vitality. Inequalities are also evident in urban areas: As rents skyrocket in one corner of the city, poverty persists just miles away. Which cities will flourish sustainably, and which will fade away? The answer will define America's future – not just for urbanites, but for all of us.
We analyzed the latest data from the U.S. Census Bureau, Bureau of Economic Analysis, and Bureau of Labor Statistics, studying the recent rise or decline of the country's 50 largest metropolitan areas. For each city, we investigated a range of relevant statistics, from population growth and poverty rates to unemployment and internet access. Our findings affirm the prosperity of certain cities while revealing distinct downturns in others. In some cases, our data present contrasting possibilities: Is a city poised for revitalization or doomed to permanent decline?
Finally, we produced a comprehensive ranking of the well-being of these 50 cities. For a definitive account of which American cities are thriving and dying, keep reading.
Attraction vs. Contraction
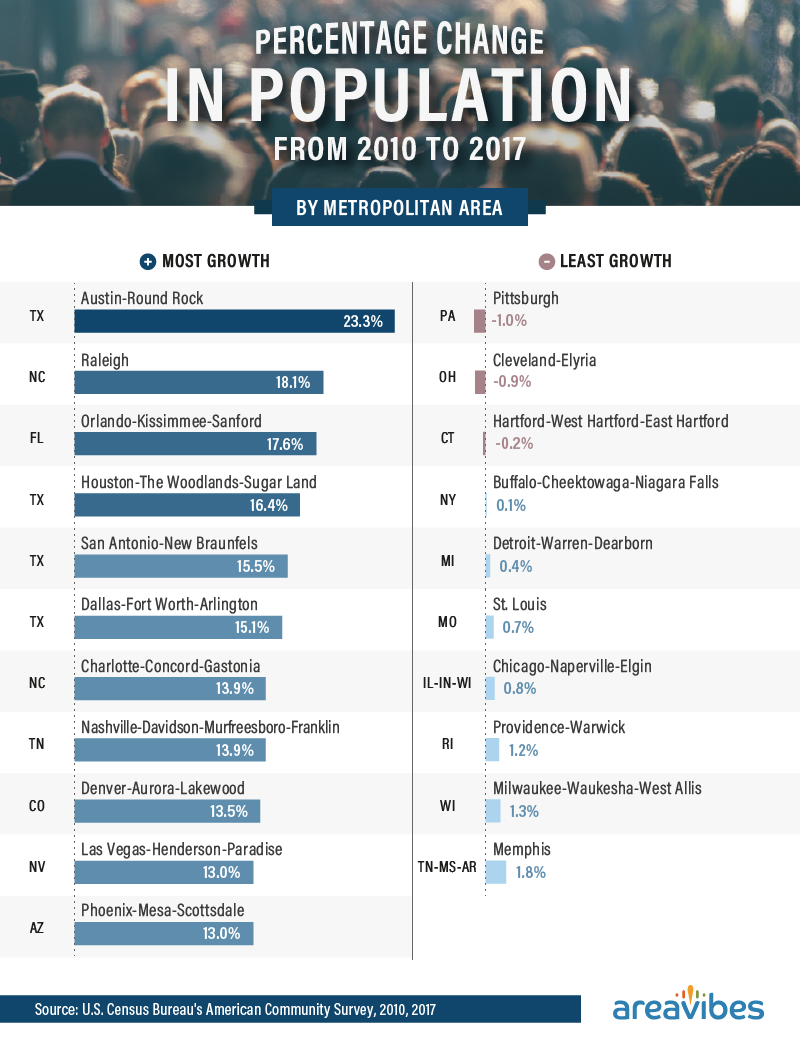
Recent years have seen an influx of Americans to urban areas: While suburban population growth has outpaced city rates for decades, the gap has narrowed dramatically. Yet, this urban growth has been uneven with hubs like Austin, Texas, and Raleigh, North Carolina, sharing disproportionately in the population surge. A rush of new residents provides distinct economic benefits. Austin and Raleigh possess two of the nation's strongest metropolitan economies, while third-ranked Orlando has enjoyed a business boost as well. However, population growth presents clear challenges as well: If rents in these cities remain reasonable for now, competition for housing may soon put them out of reach for many residents.
At the other end of the spectrum, some cities actually contracted slightly between 2010 and 2017. Pittsburgh and Cleveland saw their populations fall by 1 percent during this period, a part of a longer trajectory of decline from their midcentury industrial heydays. Among the large cities with the least growth, a consistent theme emerged: Many are the former manufacturing hubs of the Rust Belt, which have seen factory jobs vanish in recent decades. Yet, other cities on this list are showing definite signs of a turnaround in progress. Memphis, for example, has generated significant investment in its downtown area, positioning itself for a boom much similar to Austin's.
Uneven Economies
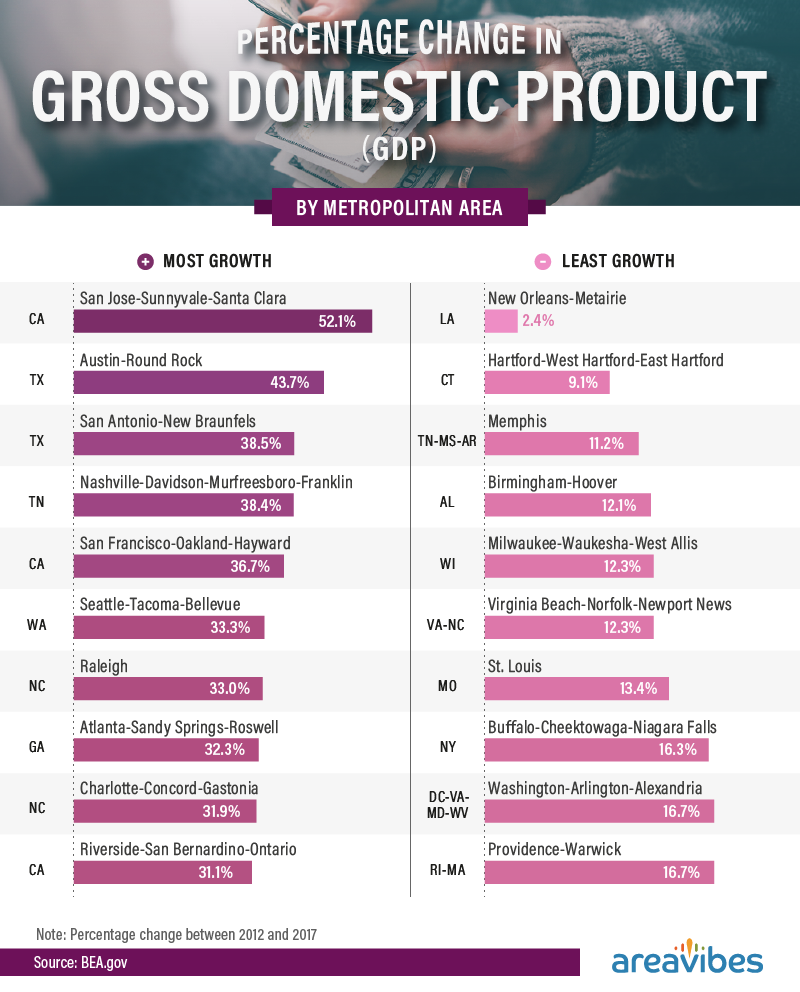
Between 2012 and 2017, no urban area enjoyed as much economic growth as San Jose and its surrounding towns. Buoyed by the presence of major tech players, GDP in the San Jose area surged 52 percent. Two areas in Texas followed: Austin and San Antonio ranked second and third respectively, contributing to a broader boom in business across the state. Nashville filled out the top four, expanding its economy by over 38 percent between 2012 and 2017. In fact, the city has struggled to keep pace with its own prosperity. Nashville businesses have faced difficulties finding enough workers, even as transplants arrive in droves.
By contrast, the New Orleans area saw its GDP grow merely 2 percent during the period studied. Research suggests that the city's economy is driven by racial inequality: Residents of color enjoy fewer opportunities than their white counterparts. Hartford and its surrounding environs had the second-least growth, reflecting Connecticut's broader economic malaise. Interestingly, the metropolitan area around Washington, D.C., showed limited growth as well, a trend likely to be reversed by Amazon's decision to place a headquarters in Arlington, Virginia.
Poverty Prevalence
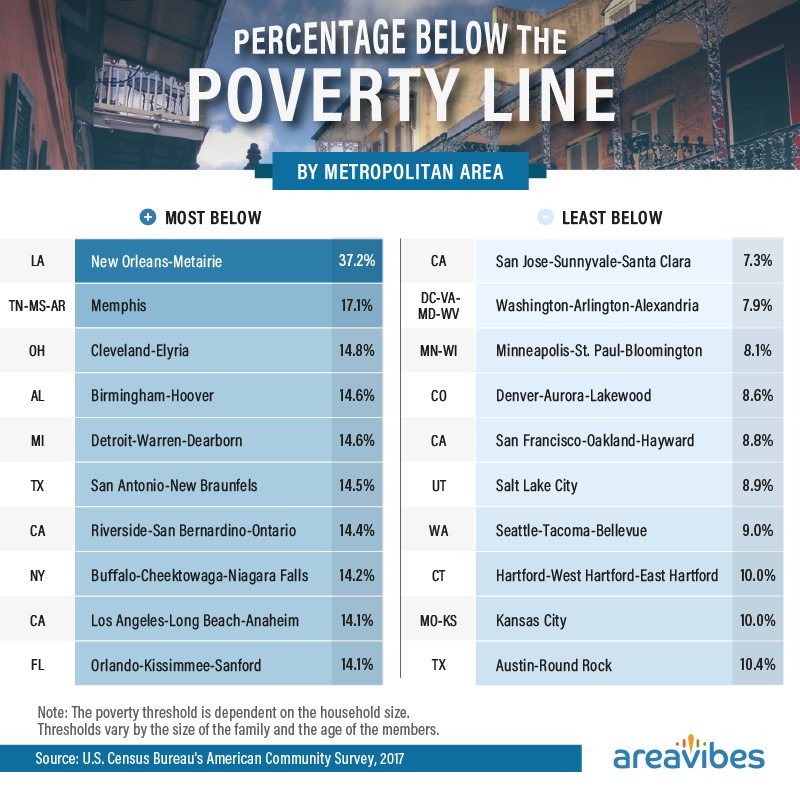
To assess the financial circumstances of individuals and families, the U.S. Census Bureau uses "poverty thresholds" – dollar income amounts under which families of various sizes are considered to be living in poverty. In New Orleans, 37 percent of residents lived below the poverty threshold in 2017, a far higher rate than in any other city studied. Moreover, the city is defined by deep income inequality: While some residents flourish, many predominantly black neighborhoods still feel the lingering effects of Hurricane Katrina. In second-ranked Memphis, where 17 percent of residents lived below the poverty line, wide racial income disparities persist as well.
In some cities, however, fewer than 1 in 10 residents lived in poverty. The D.C. metro area had the lowest poverty rate overall: The five counties in America with the highest median incomes all surround the capital. Similarly, the Minneapolis, Denver, San Francisco, and Salt Lake areas boasted extraordinarily low poverty rates. It's worth noting, however, that poverty thresholds apply nationwide – and thus don't account for local costs of living. In pricey San Francisco, for example, families with six-figure incomes can struggle to make ends meet, despite being well above the poverty threshold.
Issues of Employment

National unemployment rates have steadily declined since 2009 when the aftershocks of the Great Recession left millions of Americans sidelined from the workforce. Yet, in several cities, unemployment remained unfortunately high in 2018, with 5 percent of residents going jobless. This was the case in the Cleveland metro area – although it must be said that the area's unemployment rate was as high as almost 10 percent in 2010. Interestingly, the area surrounding Chicago also neared the top of our list. Even though the city's workforce has swelled since the recession, black residents have not shared proportionately in these opportunities.
Denver and Nashville boasted low unemployment rates overall. For some companies in these cities, tight labor markets are proving challenging: Denver employers are offering previously unheard-of perks to attract talent, while experts say Austin needs an influx of professionals to keep its current boom rolling. The Milwaukee area also boasted low unemployment, a fact that might bode well for the city's future population growth. Yet, elsewhere on this list, labor shortages have imperiled economic growth.
Homes Uninhabited
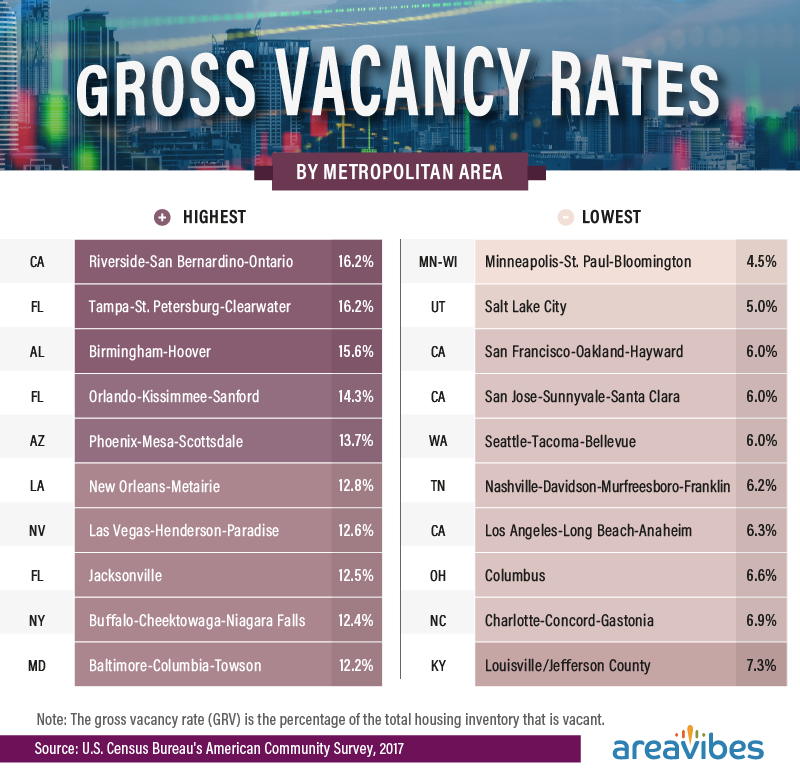
In some areas, housing stock is an infamously precious commodity: In the Twin Cities, where just 4.5 percent of homes were vacant in 2017, local authorities have declared the lack of housing a crisis. Legislators from the Salt Lake City area are reckoning with similar challenges, as a dearth of available homes have sent housing costs rising at twice the rate of incomes. Three tech-heavy areas rounded out the top five: San Francisco, San Jose, and Seattle each had vacancy rates of just 6 percent. Indeed, some tech giants have joined efforts to create affordable housing in these cities, acknowledging their impacts on local real estate markets.
By contrast, 16 percent of homes in the Riverside-San Bernardino area laid vacant, and the same percentage were unoccupied in the Tampa area. In the Birmingham metro area, which faced similar rates of unoccupied housing, local leaders recently approved plans to demolish roughly 300 abandoned houses in an attempt to reduce urban blight. Interestingly, vacant homes do not always suggest a lack of need for housing. In the Phoenix area, where nearly 14 percent of properties are uninhabited, evictions have soared as low-income residents struggle with rising rent prices.
Internet Exclusion

If many consider the internet a modern necessity, large portions of major cities go without it each day. In Memphis and New Orleans, around 1 in 5 residents lack internet access at home. Despite evidence that low-income Americans are increasingly gaining access to the internet, these findings suggest that many urban residents remain disconnected from vital digital resources. Conversely, in tech-centric locales such as San Jose, Seattle, and San Francisco, fewer than 1 in 10 residents lacked internet access.
Memphis and New Orleans also ranked near the top for the percentage of residents without personal computers, alongside Buffalo and Pittsburgh. To some extent, these findings could reflect a cultural shift in the devices we use: Smartphones have outpaced desktop and laptops in popularity, and low-income households may not invest in multiple ways to get online. Yet, personal computers remain relevant, especially for school-aged children. According to one federal study, 90 percent of high schoolers now do at least some homework online – meaning many don't have the tools necessary to complete their assignments at home.
Supporting Seniors
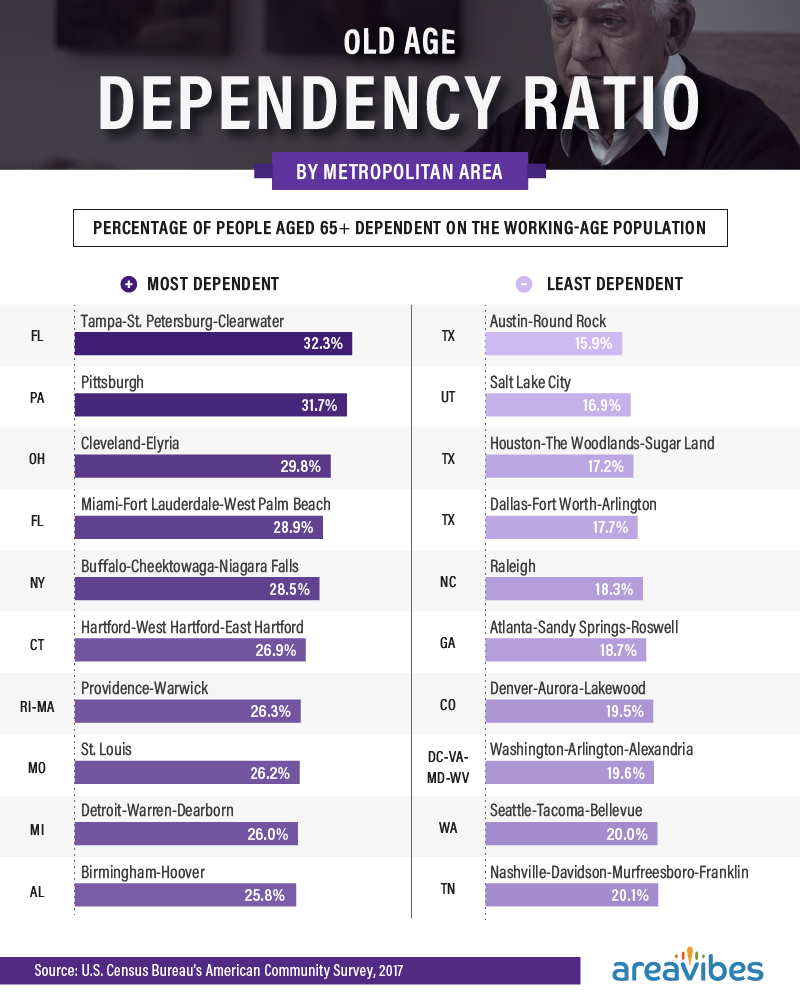
In some cases, cities appeal particularly to senior citizens: The Tampa Bay area has long been viewed as a retirement destination, accounting for its high percentage of dependent older adults. In second-ranked Pittsburgh, however, the large percentage of elderly residents may have more concerning origins: Recent research suggests that professionals are fleeing the city, leaving retirees behind. In the Cleveland area, ranked third for the percentage of dependent older adults, the ongoing "graying" is a part of a broader regional trend. By 2030, 1 in 3 residents of Cuyahoga County (which includes Cleveland and its suburbs) will be over 60.
In the Austin metro area, however, less than 16 percent of residents were elderly dependents. Salt Lake, Houston, Dallas, and Raleigh boasted similarly low figures. You'll notice a significant overlap between these cities and the places that have enjoyed the greatest population growth in recent years. It's easy to see the connection between these statistics: As young professionals head to these cities and start families, elderly residents come to represent a smaller portion of the population.
Metropolitan Matchups
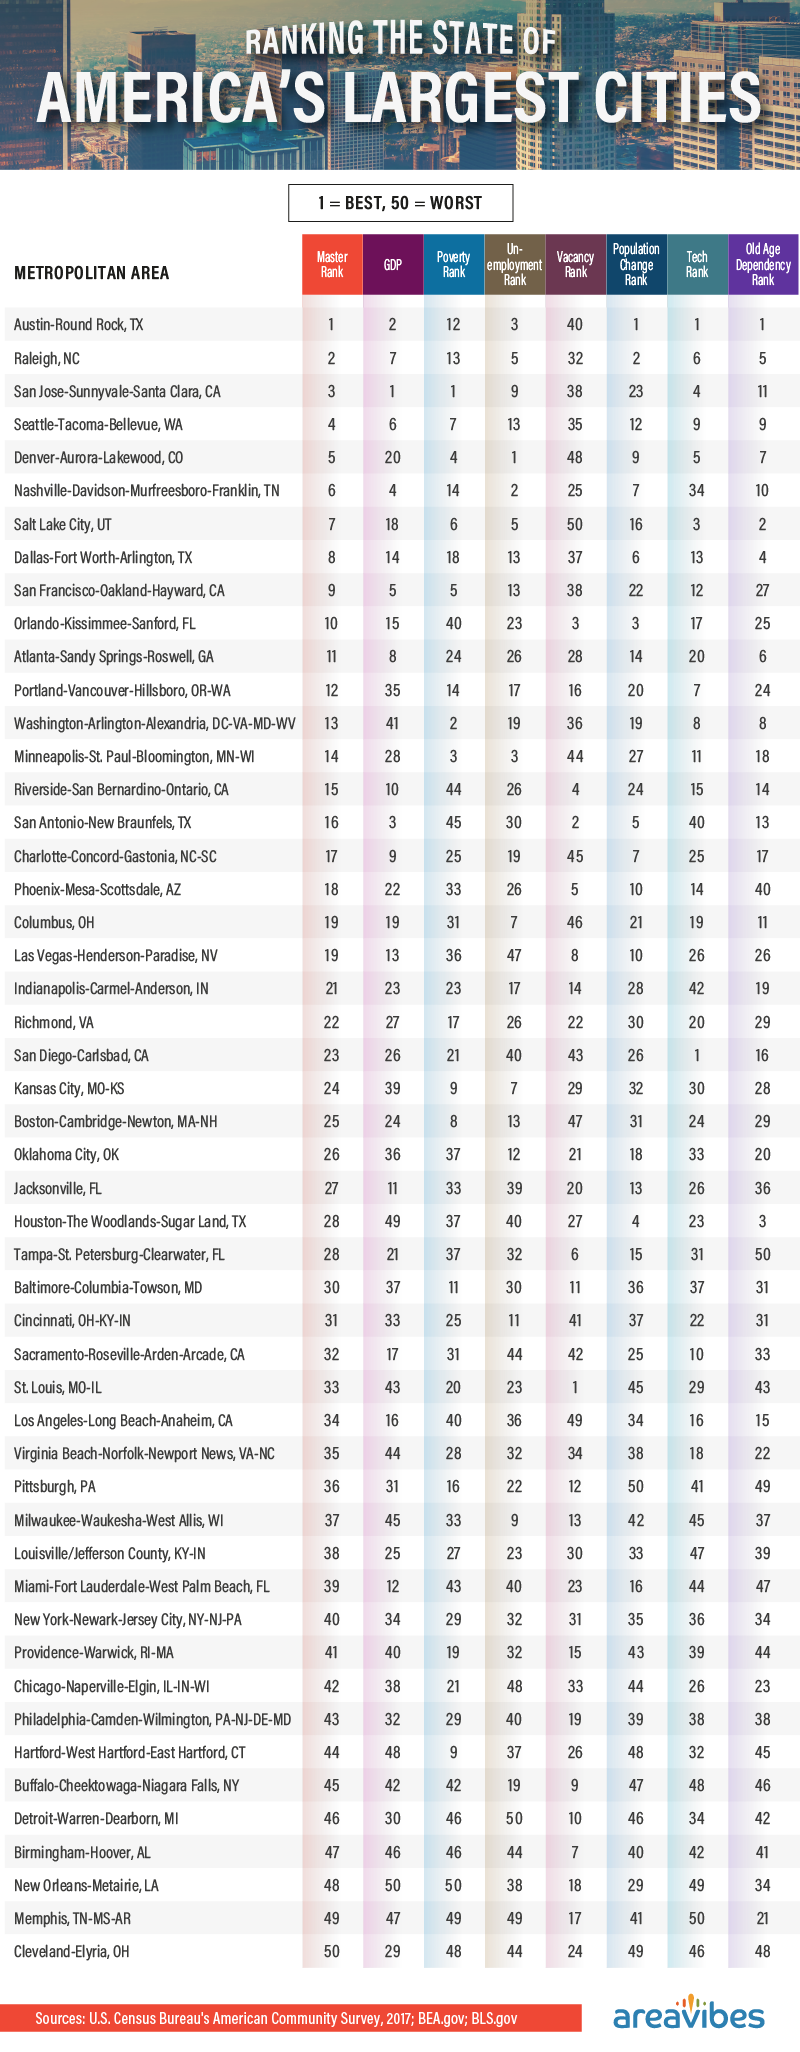
After analyzing each of these statistical categories independently, we compiled our findings to arrive at a cumulative score for each city. Congratulations, Music City: The Austin metro area outperformed all others, taking the top spot in our ranking of America's largest cities. Raleigh claimed the second-place spot, followed by San Jose in third. These top cities share some essential advantages, including exceptional GDP growth as well as young and growing populations.
Additionally, you may find some surprises near the top of our list: The Nashville and Raleigh metro areas posted scores that compete with some powerhouse cities like Austin and Denver.
On a more serious note, we don't mean to belittle major cities navigating challenging times. All of the places that fared poorly in our rankings, such as Cleveland and Detroit, have rich histories in which their residents can take pride. We hope our data call attention to potential areas of improvement, from rates of unemployment to limited tech access. If these areas hope to revitalize eventually, local leaders must address these pressing challenges.
Urban Optimism
Our findings suggest the sheer variety of urban America, from metropolises teeming with opportunities to cities long past their peaks. Moreover, they reaffirm the stark contrasts that frequently exist within a single city – and the difficulties that often go unnoticed by tourists. Beneath New Orleans' reputation for celebration, entrenched poverty continues. Despite Chicago's iconic skyline, high rates of unemployment persist. No city can be reduced to a single experience: Across lines of culture and privilege, residents of the same city can inhabit vastly different realities. When we weigh a given city's prospects for the future, we must consider all those who call it home.
Yet, our findings also provide much reason to remain hopeful. Decades ago, many of the cities we deemed most desirable had not yet begun their economic transformations. In the story of American cities, there is one constant: the pursuit of opportunity. Drawn by job openings or low costs of living, families may soon revitalize the cities that ranked poorly in our results. If Nashville, Austin, San Antonio, and Raleigh have emerged as the most attractive largest cities in the country, who's to say your city won't be next?
Methodology
To generate a list of cities for this project, we used the 50 largest metropolitan areas by population as of the 2017 American Community Survey and rated each city across seven key dimensions:
- Poverty – 2017 percentage of population ACS
- Access to technology (internet subscriptions, computer ownership percentage, percentage with dial-up) – 2017 ACS
- Unemployment rates – 2018 BLS
- Housing vacancies – 2010 to 2017 ACS
- Gross domestic product – BEA.gov 2012 to 2017 – calculated percentage change
- Overall population growth – 2010 to 2017 percentage change ACS
- Old age dependency ratio – 2017 ACS
We ranked each factor in each category to create a final score for each category. The final score was then given a master rank to create the "Overall Rank." All categories were weighted equally.
Fair Use Statement
Wherever you reside, we hope you'll share our results far and wide online. We do have two simple requests: Please use our work only for noncommercial purposes and link back to this page to attribute our team appropriately. Like proud residents of any city, we appreciate a little credit for the things we create.