
The U.S. is home to citizens of all different backgrounds. That’s why you’ll find Chinatowns in multiple cities and celebrations of heritage – like German Fest in Milwaukee – that showcase the pride and respect Americans have for their ancestors who moved here (either long ago or recently) to plant their family tree.
Whether first generation or fully planted, we wanted to provide a better picture of where we come from and who we are as Americans – so we looked at data provided by the U.S. Census Bureau, which counts residents every 10 years as mandated by the Constitution. Keep reading to see what we found.

You’re most likely to find German immigrants in North Dakota and Wisconsin, where over 4,100 people (per 10,000 residents) share a German heritage, while you’ll have the best chance of connecting with your Irish roots in Massachusetts, where nearly 2,200 Irish people reportedly live.
Use our interactive tool above to discover how diverse the U.S. truly is. Select a specific ancestry to see the number of people per 10,000 residents who were reported by the top 10 states in the latest U.S. Census Bureau report.
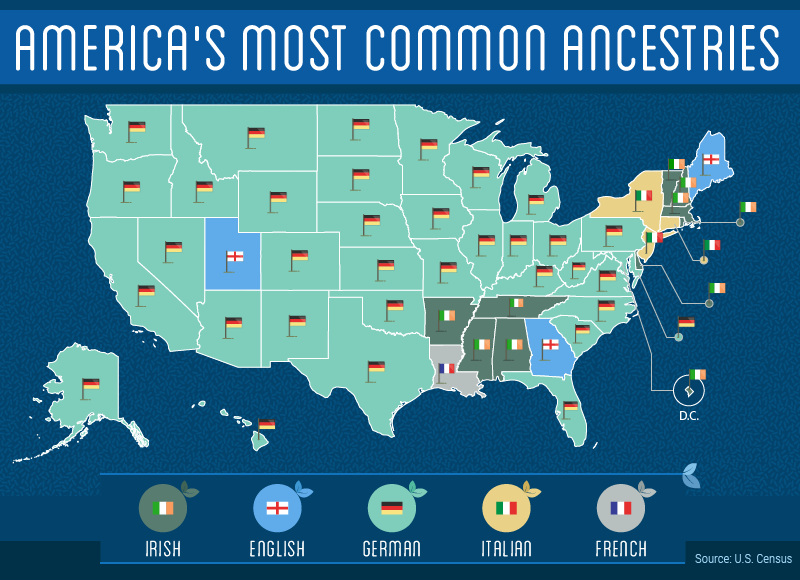
Almost 70 percent of the 50 states reported that German residents made up the largest portion of their populations. While English, Irish, Italian, and French (hello, Louisiana!) ancestry reigned supreme in a few states, German was the most prominent reported ancestry everywhere else. The Economist has even labeled the German population a “silent minority” due to how well they’ve integrated into the larger American identity.
With states like Massachusetts, home to the second-largest St. Patrick’s Day parade in the United States, the Irish roots we see planted firmly in this region aren’t just there by luck. Throughout the rest of the Northeast, there’s a substantial cluster of states – Vermont, New Hampshire, and Rhode Island, and Delaware – reporting ties back to Ireland. Many states in the region also show strong ties to Italy: New York, Connecticut, and New Jersey.
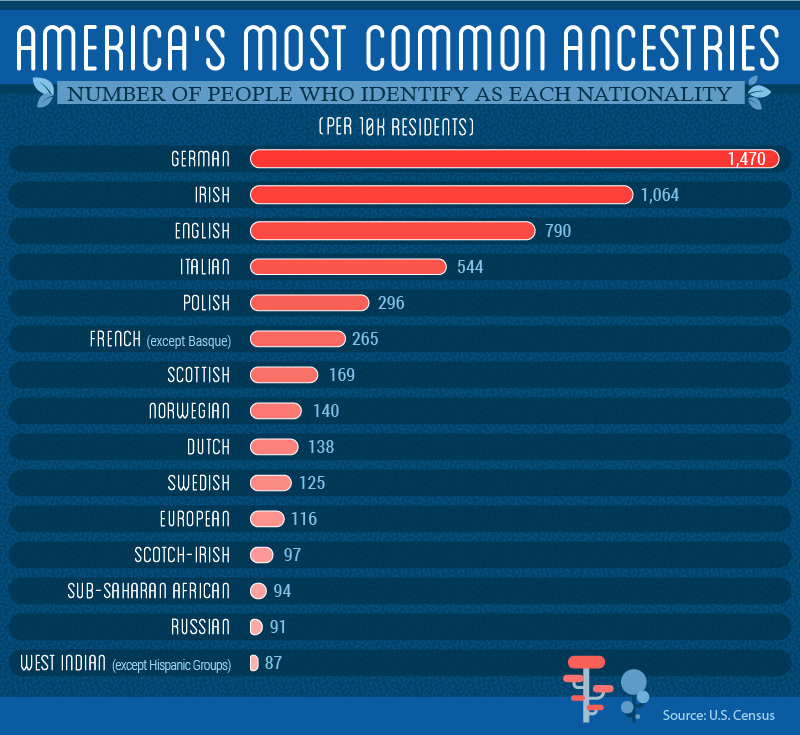
After German ancestry, residents with Irish ancestry were the second-most-common nationality throughout the country. In fact, over 1,000 people per 10,000 residents indicated that they had family history connected to Ireland. This could be why St. Patrick’s Day is so popular despite not being recognized as a federal holiday by the national government. And the third most prevalent ancestry hails from Ireland’s next-door neighbor, England: 790 people per 10,000 residents reported English ancestry in their family. Italian ancestry, the influence of which can be easily seen in areas like New York and New Jersey, placed fourth with 544 people per 10,000 residents.
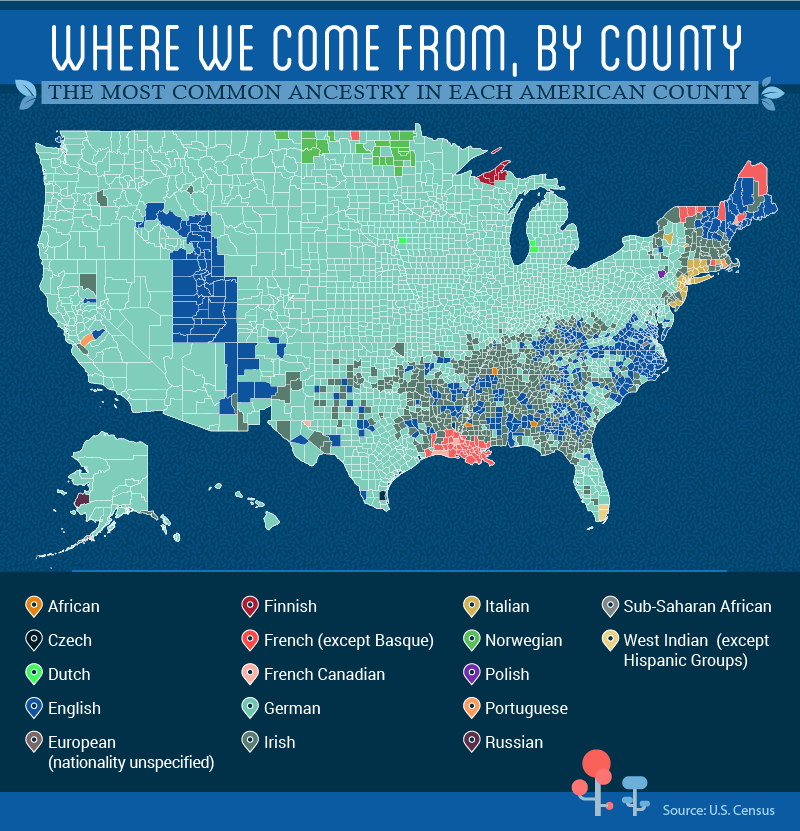
While German- and Irish-Americans make up a larger majority of the overall population, a significant number of counties across the country, especially in Virginia, Maine, and Utah, report that English ancestry is the most common. There are also many residents who have declared Norwegian heritage in counties within North Dakota and Minnesota. Several Maine and New York counties nearest to the Canadian province of Quebec also reflect the history of Quebec’s settlement by French explorers, showing a French-ancestry population as the most prevalent.
Along the borders of Canada and the U.S., you can also see that people living in counties that border Quebec report French as their ancestry.
America continues to be the “great experiment” that philosopher Alexis de Tocqueville observed while writing Democracy in America. Our ancestries help to create a diverse experience for our neighbors and loved ones. It’s a chance to teach those around us about the practices of our distant relatives, while also contributing to American culture. Within Chinatowns, Little Italys, and other cultural-based communities in the U.S., we can see the importance of keeping heritages strong and tied to family roots.
Whether you’re looking for the city with the best Koreatown or a thriving Irish culture, finding the right home is important. Locate the most livable areas across the country with AreaVibes, because where you move should always feel like home.
We used data provided by the U.S. Census Bureau to explore the reported ancestries of people within each state and calculate per capita rates. People reported as “American” were excluded from our analysis. French ancestry excludes Basque, and West Indian ancestry excludes Hispanic groups.
Fair Use Statement: Share our content with your diverse readers for noncommercial purposes only. Just make sure you link back to this page so our ancestors (or authors) receive proper credit.