
 Amenities
The area boasts an ample array of local amenities, such as restaurants, entertainment options, grocery stores and parks, all conveniently located within walking distance.
 Commute
A high commute score suggests convenient, easy access to public transportation, with shorter-than-average work commute times to work.
 Cost Of Living
The cost of living in this region is notably lower than the national average, encompassing everyday goods, housing, utilities, transportation and health care expenses.
 Housing
High scores in the housing category are attributed to this area, possibly pointing to a favorable home affordability ratio, robust appreciation rates or elevated home values.
 Health & Safety
Achieving a high health and safety score relies on factors including great air quality and convenient access to vital health facilities such as hospitals, doctors, clinics and police stations.
 Crime
Crime
This area exhibits elevated crime rates per 100,000 residents, which may suggest it's a potentially unsafe place to reside. These rates encompass both property and violent crimes.
 Employment
Low income levels and high unemployment rates results in a low score in the employment category. It could prove difficult to find well-paying employment in this area.
Daytona Beach is a medium-sized city located in the state of Florida. The city has a population of 68,711 inhabitants. Individuals of White (56%) and Black or African American (35%) backgrounds make up a significant portion of the population of the city. Daytona Beach is very likely to be a great place to live for singles as only 42%, of the population (over fifteen) are classified as married. Not a fan of sitting in traffic during your commute to work? Daytona Beach offers shorter work commutes, with an average one-way commute time taking only 19 minutes, far lower than the national average of 26 minutes.
Whether you’re relocating to a new city to be closer to family, friends or for a new job, living in Daytona Beach could be a positive experience compared to other cities in Florida if you know where to look. Don't forget to determine what matters most to you in a neighborhood. Consider factors such as safety, proximity to work or school, access to amenities (like parks, fitness facilities, grocery stores, restaurants), public transportation options, community atmosphere and the overall vibe you're looking for. With useful information like crime, education, employment and other key data points, finding the best places to live in Daytona Beach and in the areas around Daytona Beach is a much easier task.
Daytona Beach, FL receives 79/100 for its livability score; this results in a ranking of #107 in Florida and #1,538 in the USA. Pack your bags! This is a very high score in comparison to other US cities. Living in Daytona Beach could be a great choice! Another exciting tidbit, is that Daytona Beach ranks better than 90% of all US cities! If we probe a little deeper into each category within the livability score, we see that Daytona Beach has higher than average grades for the following: amenities (A+), cost of living (A+) and housing (A). On a more negative note, Daytona Beach does not have favorable scores for the following: crime (F) and employment (F). If we take a look at the data, we can find out why.
If you're living in Daytona Beach, you can expect to enjoy a multitude of local amenities, mostly thanks to the strategic placement of essential services such as grocery stores, restaurants, coffee shops, parks and various shops. If you're contemplating a move to this locale with the intent of establishing it as your permanent residence, you'll be pleased to find an extensive array of amenities and recreational opportunities within easy reach, either on foot or via a brief commute. This wealth of accessible amenities not only enhances the livability of the area but also ensures that you can enjoy a rich and fulfilling lifestyle, making Daytona Beach an attractive destination for those seeking a vibrant and well-served community to call home. A few of the enjoyable things to experience and sights to see are: Daytona International Speedway, Ponce Inlet, and Angell & Phelps Chocolate Factory.
Finding affordable real estate and housing in Daytona Beach can be tricky. Having said that, this area might be the place to get the best of both worlds. Based on factors like home/rental affordability and appreciation rates, this area has received an above average score in the housing category. A healthy real estate market can lead to wealth appreciation for property owners, as rising property values can contribute to homeowners' equity, financial stability and the ability to build long-term wealth.
Being close to public transit, grocery stores, parks and other conveniences are all important when weighing your options for a new home in Daytona Beach. Before you determine if any of these amenities are available in the area, you will also want to know if the real estate prices in Daytona Beach are affordable. The median home price for Daytona Beach homes is $164,400, which is 1.4% lower than the Florida average. If we take a closer look at the affordability of homes in Daytona Beach, we’ll see that the home price to income ratio is 4.3, which is 26.5% higher than the Florida average.
| Statistic | Daytona Beach | Florida | National |
| Average one way commute | 19min | 27min | 26min |
| Workers who drive to work | 76.6% | 79.5% | 76.4% |
| Workers who carpool | 8.5% | 9.3% | 9.3% |
| Workers who take public transit | 3.8% | 2.1% | 5.1% |
| Workers who bicycle | 1.8% | 0.7% | 0.6% |
| Workers who walk | 2.7% | 1.5% | 2.8% |
| Working from home | 4.6% | 5.4% | 4.6% |
 Here are the best places to live in Florida
 Most Dangerous States In The US
 These are the largest cities in Florida
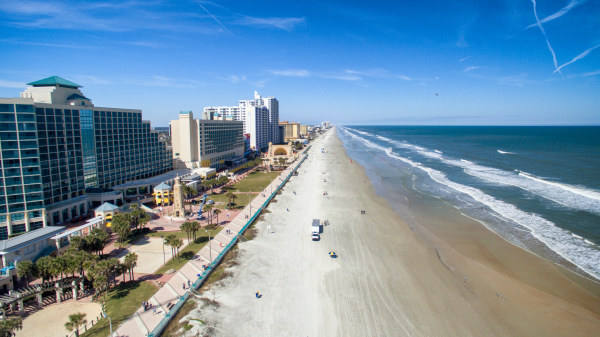 See the best places to live in Daytona Beach