
According to the US Census Bureau's "American Community Survey", nearly 16% of Americans still didn't have home internet access in 2017. But it's the whos, wheres, and whys behind this lack of access that may impact the desirability to live in certain states.
In an age when it seems like every person is hooked up to an IV drip of uninterrupted digital input, it's easy to take complete accessibility for granted. But with the internet serving as a highway to nearly all opportunities for advancement and affluence, lacking access to this essential tool can have a big impact on people's quality of life. We wanted to take a closer look at the hidden technological divide in America and explore the realities of internet accessibility (or the lack thereof).
To acquire the scope and accuracy necessary for our study, we turned to two data sources provided by the U.S. government: the Digital Nation Data Explorer, provided by the National Telecommunications and Information Administration (NTIA), and FactFinder.Census.gov, a database of the surveys conducted by the U.S. Census Bureau.
The NTIA is a branch of the U.S. Department of Commerce that advises the president on telecommunications and information policy issues in America. In 1994, the NTIA commissioned the U.S. Census Bureau to collect data about the nation's computer use. This data has been analyzed and used in reports for the president and, in recent years, was made available to the public through the Digital Nation Data Explorer.
The U.S. Census Bureau conducts several national surveys every year, collecting information about the quality of life in households across America. Two of these surveys, the American Community Survey and the Current Population Survey, ask questions specifically about computer and internet use in American households. These are the surveys we accessed to paint a clear picture of internet use and accessibility and to see where the tech divide is greatest for Americans.
Before we can make sense of the significance of those who don't have access to the internet, we need to understand the role the internet plays in our modern society. For this, we began with a profile of Americans who are accessing the internet.
Who Is Accessing the Internet?
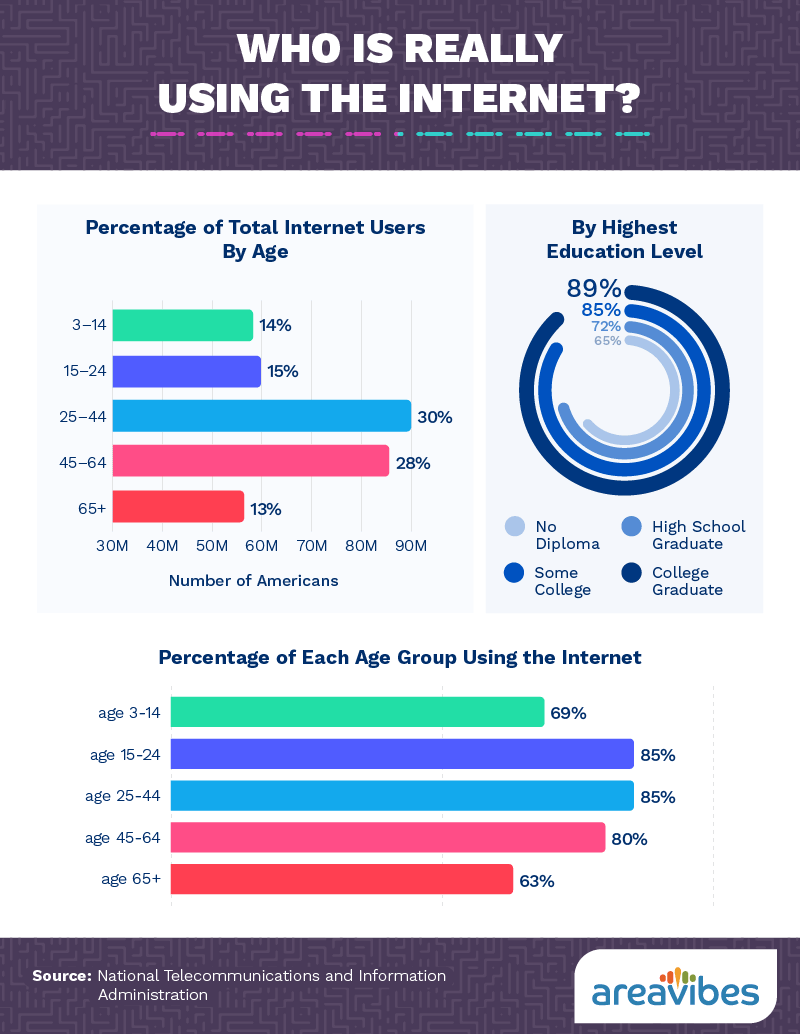
The chart in the upper left-hand corner shows the percentage of total internet users falling into each of the five age brackets. As you might expect, it was the 25- to 44-year-olds who were the biggest internet users in 2017, and those aged 65 and older made up the smallest portion. Perhaps more surprising is the fact that 15- to 24-year-olds only made up 15% of total internet users in 2017. A companion comparison to the first chart took a look at the total percentage of each age group on the internet.
These statistics are important to see because they show the impact that non-accessibility can have. With younger generations showing increased connectivity and even dependence on the internet, we can infer that a lack of accessibility will impact the future of younger generations more significantly than older generations.
We also found a strong correlation between one's education level and accessibility to the internet. As the total level of education completed decreased, so did the likelihood of internet use. Almost 90% of college graduates were active internet users, whereas only 65% of individuals with no diploma were online.
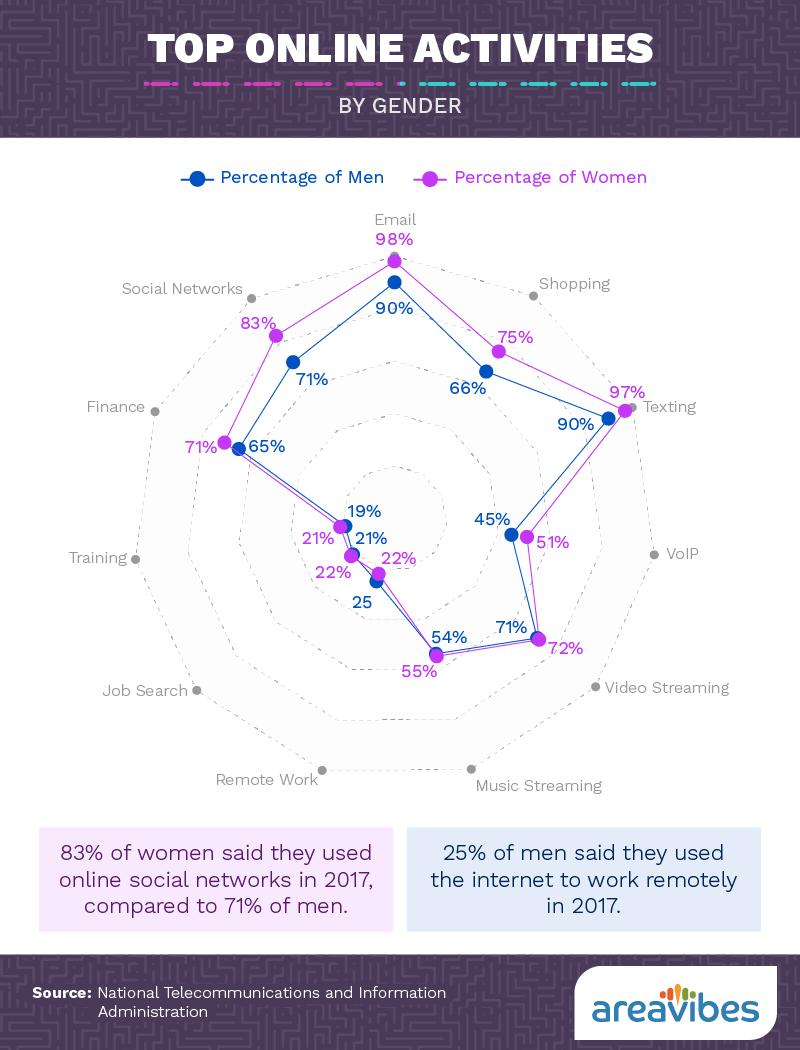
Texting and email were the most common online activities for both genders in 2017, followed closely by networking on social channels and shopping. Finance-related tasks and video and music streaming were also common.
It's important to note that communication and networking (the two main online activities) are essential elements in the modern career climate. For example, according to a recent article by HubSpot.com, nearly 85% of jobs are filled through networking, and 83% of people work remotely (possible, in large part, due to internet communication) at least part of the time.
Internet use and, therefore, access to the internet has a tremendous impact on our modern lifestyles. This is why it's so significant to shine a spotlight on the hidden tech divide and point out where this essential access to the internet is lacking.
Who Doesn't Have Access?
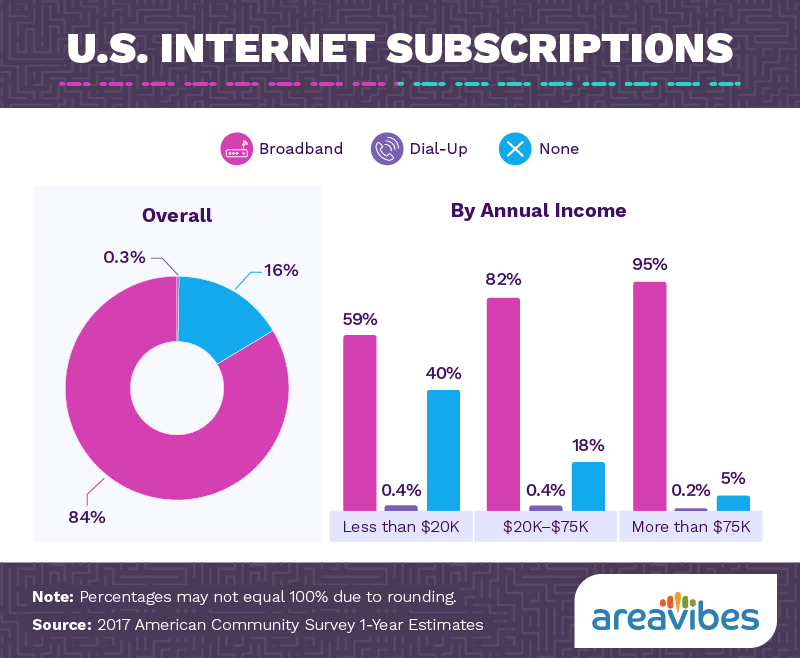
These two simple charts wield dramatic revelations for our modern society. In 2017, 16% of Americans had no internet subscription in their home. Broken down by income, we see plainly that income has a strong correlation to accessibility: 40% of those making less than $20,000 a year lived without home internet, compared to 18% of those making $20,000 to $75,000 and just 5% of those making more than $75,000.
This begs the question: Could a lack of internet access factor into Americans' ability to generate income that can afford a greater quality of life? Some might suggest these individuals could be accessing the internet in other places and have no need for home internet subscriptions, but our next chart gives us a bit of perspective on this suggestion.
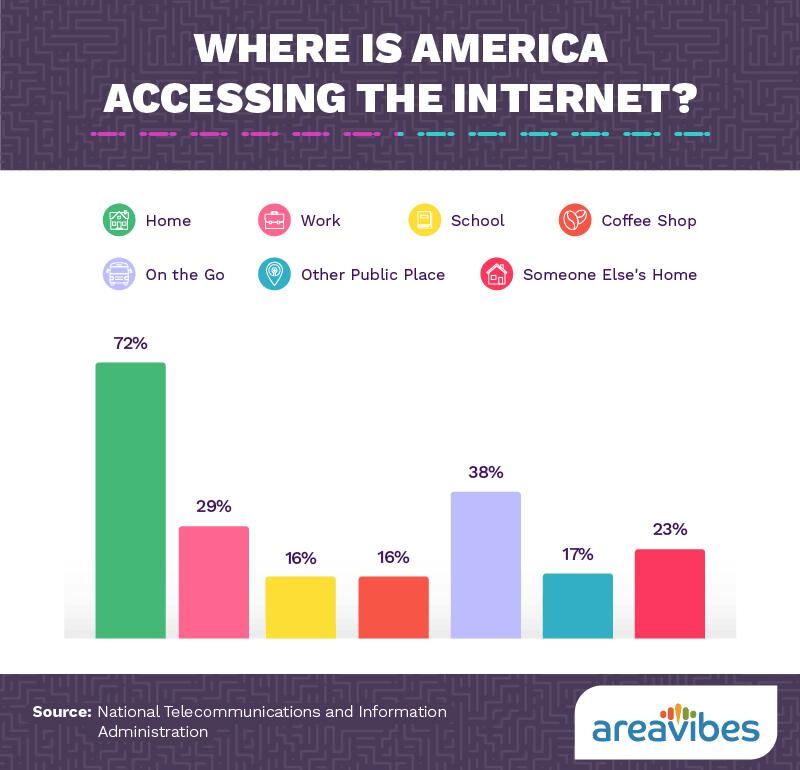
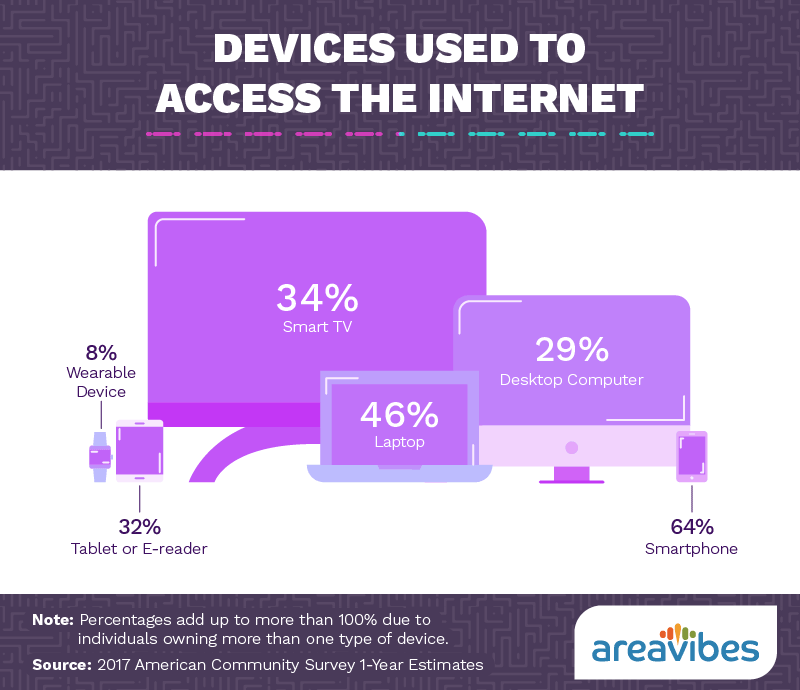
Looking at this comparison, it is incredibly clear that home internet access dominates the American lifestyle. While 72% of Americans reported using the internet at home, 38% said they use the internet on the go (we can thank smartphones for that). Aside from the expected use at the workplace (29%), it's pretty clear that accessing the internet outside the home is not the preferred method.
America's Tech Gap: Location and Income
So is accessibility a problem across all of America? In fact, where you live could play a huge role in your ability to access the internet. From 1998 to 2017, the race for internet adoption crossed the U.S. with a surprising amount of variation. States in the Northwest (Oregon, Washington, and Utah) showed the highest amount of interest and the most intense adoption of internet usage throughout their population. Alternately, states in the South lagged behind, taking until 2017 to even surpass an internet user base of 70% of their population.

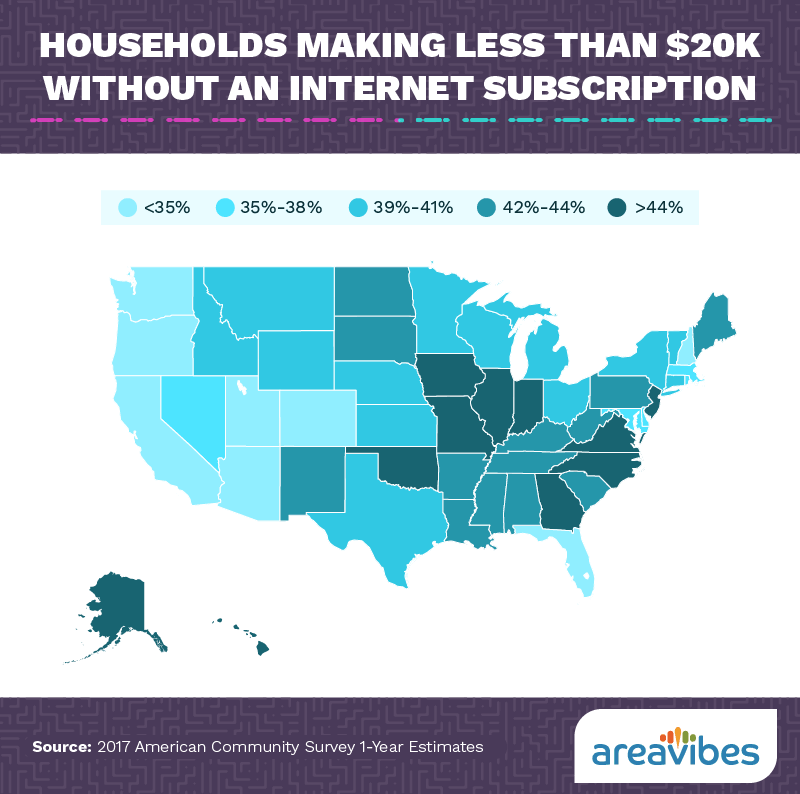
Comparing this map to the previous timeline, we discovered a strong trend once again: It's the Western states that are far ahead of the pack for accessibility, and it's in the South that there is a concentrated (and pointed) lack of access. If your income is under $20,000, there are definitely states where you are more likely to have internet access than you would in others.
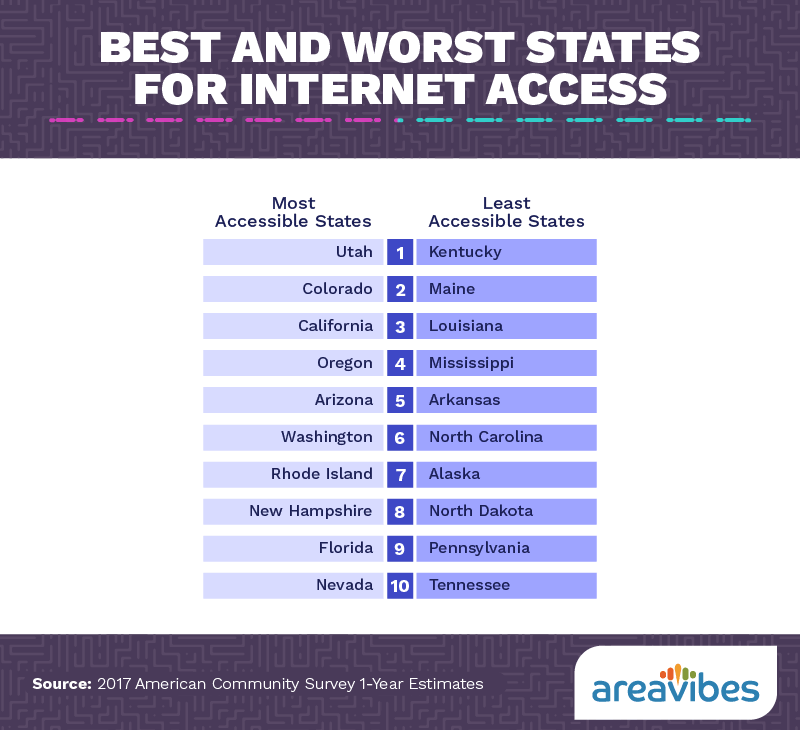
There are clearly two factors at play in determining which states are the most accessible: income and location. A comparison of accessibility based on both provides us with a strong understanding of which states really do offer the best accessibility.
First, let's consider the financial tech gap. The tech gap represents the difference between households with an income of over $75,000 that reported no internet in their home and households with an income of less than $20,000 who reported no home internet. States with a smaller tech gap have better accessibility for households of all income levels.
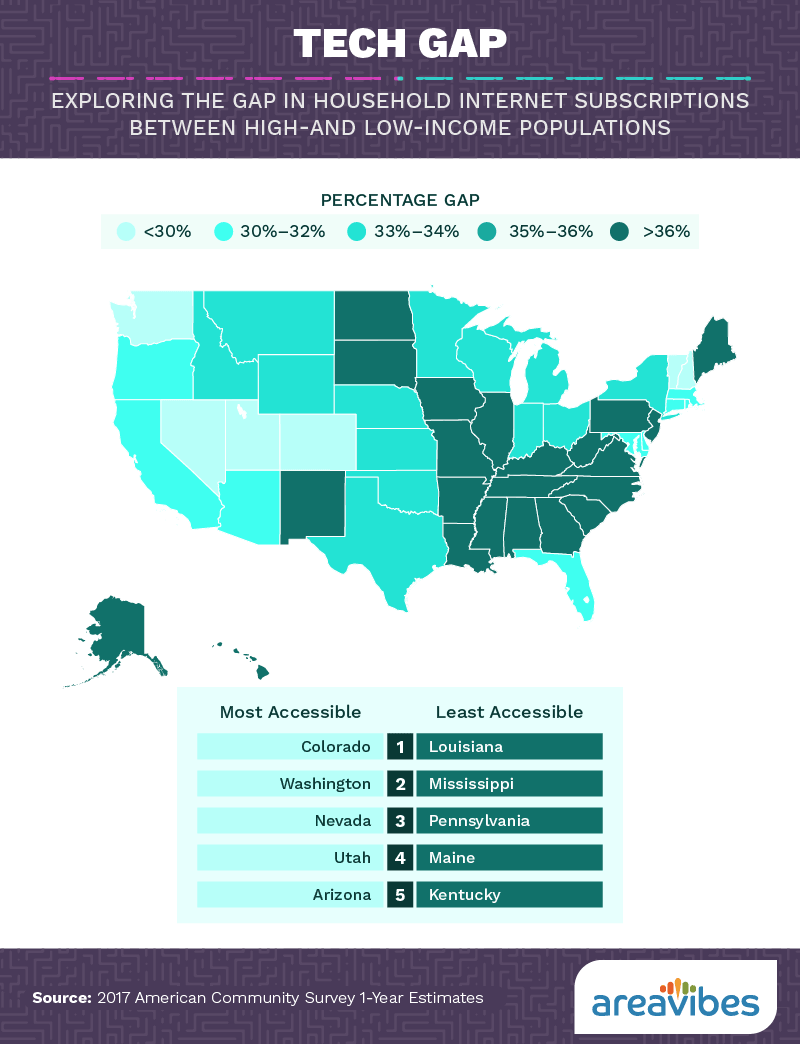
We found that Colorado had the smallest tech gap, with only a 27% difference in access for those with high and low incomes. Kentucky had the largest tech gap, with nearly a 40% difference between access for those of high and low incomes.
Rounding out the standings for those states with the smallest tech gap were Washington, Nevada, Utah, and Arizona – making these the most desirable states for households of any income that want to be hooked up and online.
But what about accessibility? Which of these states have a lower percentage of adoption simply because the opportunity isn't there for their residents to bring the internet home?
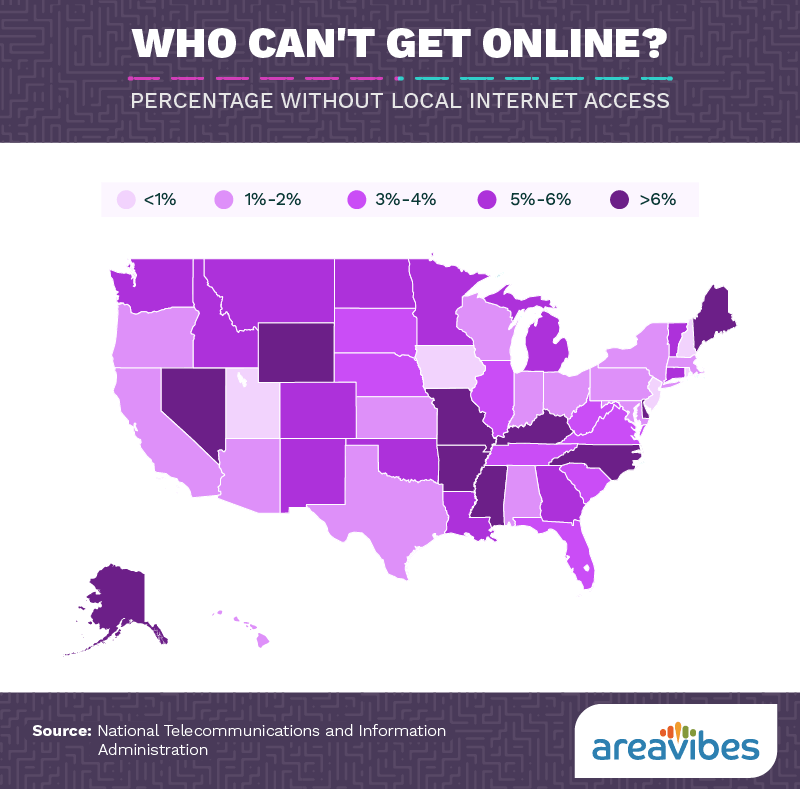
This map shows us the percentage of people in each state who couldn't go online at home because it wasn't available in their area. Many states, especially those with well-known remote populations, had a lack of availability for their residents. Below is a list of the 10 worst states for availability (those with 4% or more reporting a lack of access due to lack of availability).
1. Kentucky 8.2%
2. Maine 6.4%
3. Arkansas 6.1%
4. Delaware 5.6%
5. Nevada 5.4%
5. Wyoming 5.4%
5. Alaska 5.4%
8. Missouri 5.1%
9. North Carolina 4.8%
10. Mississippi 4.0%
While these may seem like insignificant percentages, here's a little perspective: 8.2% of Kentucky's population equates to more than 40,000 households without internet access because it is unavailable in their area. Even Mississippi, with only 4% without access, equates to nearly 13,000 homes.
In Iowa, Rhode Island, and Massachusetts, not one resident (0%) reported that the internet wasn't available to them.
As you can see, relocating to Western states may provide a better opportunity for households of all income levels to access the internet and its essential resources. Conversely, sticking it out in the South could prove rough terrain for low-income families who could benefit greatly from access to the internet.
Continuing to Close the Tech Divide
The good news is that despite the remaining tech gap in America, there is a conscious effort being made by the President and the NTIA to help narrow that gap until it is gone. Even if certain states are taking longer to adopt the internet, accessibility is spreading. With the advent of products like Google Fiber and an increasing number of large U.S. metropolitan areas offering free Wi-Fi, it seems as if the ability of Americans to get online regardless of location, income, or any other limiting factor is only going to decrease over time.
Methodology
All data for this project were sourced from the U.S. Census Bureau's 2017 American Community Survey 1-Year Estimates and the National Telecommunications and Information Administration's (NTIA) Digital Nation Data Explorer. We utilized the provided tools to extract the data directly to load into the visuals.
The U.S. Census Bureau utilizes the information from the American Community Survey to produce population, demographic, and housing unit estimates for yearly reports of data. The data used for these visuals consisted of information collected in the 2017 report. The NTIA's Digital Nation Data Explorer provided data about computer and internet use in America from December 1998 to November 2017. The NTIA, located within the U.S. Department of Commerce, is the executive branch agency that is principally responsible by law for advising the president on telecommunications and information policy issues. Data are collected from the census, as well as from FCC Form 477.
Fair Use Statement
Access to the internet is all about access to information, and we encourage you to use the information contained in this article (including visuals) on your own site for non-commercial purposes. Please, however, include a link back to this page so that our creators can be properly credited for their work.