 Employment
With higher than average median household income, income per capita and lower unemployment rates, this area scores extremely well in the employment category.
 Housing
Impressive scores in the housing category characterize this area, potentially attributed to the availability of affordable housing, strong appreciation rates and high home values.
 Cost Of Living
This area is known for its high cost of living, which means you should anticipate higher costs for everyday goods and services, housing, groceries, and health care.
 Health & Safety
Subpar air quality and the limited availability of certain health-related facilities such as hospitals, police stations, doctors and pharmacies may have contributed to the low score in this category.
Temecula, California is a mid-sized city with a population of 113,117 residents. In Temecula, there are 3,035 people per square mile, which is well above the national population density average. More than a quarter of the residents of Temecula identify themselves as Hispanic or Latino, and 15% of the population speak Spanish as their primary or secondary language. When traveling to work, spending unnecessary time in your vehicle is not ideal and downright frustrating. Across all of America, the average one way commute time is 26 minutes, unfortunately, living in Temecula offers up a higher than average one way commute time of 36 minutes.
Living in Temecula can be a good experience for anyone moving to the city. Having said that, in the state of California, there are many desirable places to live, so choose wisely! When searching for a new neighborhood, several factors play a vital role in determining its suitability. Safety should be a top priority, ensuring a secure environment with low crime rates. Proximity to your workplace or school helps minimize commuting time and allows for a better work-life balance. Availability of essential amenities such as parks, coffee shops, restaurants, grocery stores, and healthcare facilities contributes to convenience and well-being. Access to reliable public transportation options facilitates easy commuting and connectivity. Additionally, considering the sense of community and the overall atmosphere that resonates with your lifestyle and preferences fosters a harmonious living experience. With useful information like amenities, crime, cost of living, employment and other key data points, finding the best places to live in Temecula and in the areas around Temecula is a much easier task.
The livability score in Temecula is 70 out of 100 and the city is ranked in the 79th percentile of all cities across America. If we probe a little deeper into each category within the livability score, we see that Temecula has higher than average grades for the following: amenities (B), crime (A-), employment (A+) and housing (A). On a less positive note, Temecula does not have favorable scores for the following: cost of living (F). If we take a look at the data, we can find out why.
Temecula has many conveniently situated amenities and captivating attractions that adds to the continuous enjoyment of your everyday life. Having the assurance of abundant conveniences and a wide array of activities ensures your easy access to nearby grocery stores, restaurants, bars, fitness facilities, coffee shops and exciting entertainment options. This not only simplifies daily routines but also fosters a vibrant and dynamic lifestyle within the community. With a wealth of resources at your fingertips, you can savor the convenience and variety that Temecula has to offer, making it a desirable destination for those seeking both accessibility and enjoyment in their daily lives. Some of the more notable entertainment options include: Temecula Valley Jeep & Wine Tours, Rockin' Wine Tours, and Destination Temecula Wine Tours and Experiences.
Crime rates can be the deciding factor for anyone looking to relocate to a new area, as the result is often a greater level of safety and security as well as an improved quality of life. Temecula gets top scores for their low violent crime rates of 157 crimes per 100,000 residents, which are significantly lower than the national average.
A robust real estate market serves as a crucial economic indicator, reflecting the local area's strength, stability and the confidence of its residents. Temecula excels in the housing sector, scoring high marks based on factors such as median home and rental prices, appreciation rates and home affordability. These calculations suggest that the apartment rental and real estate market in the region is exceptionally healthy, highlighting the area's economic vitality and attractiveness to potential homebuyers and renters.
Assuming that Temecula meets all of your requirements like low crime rates, good schools and great local amenities, the next most important item to examine is the affordability of real estate in Temecula. Everything else becomes a lot less important if it turns out that home prices in Temecula are simply unattainable. The median home price for Temecula homes is $464,900, which is 13.6% higher than the California average. If we take a closer look at the affordability of homes in Temecula, we’ll see that the home price to income ratio is 4.7, which is 26.6% lower than the California average.
| Statistic | Temecula | California | National |
| Average one way commute | 36min | 28min | 26min |
| Workers who drive to work | 77.7% | 73.5% | 76.4% |
| Workers who carpool | 10.2% | 10.6% | 9.3% |
| Workers who take public transit | 0.1% | 5.2% | 5.1% |
| Workers who bicycle | 0.1% | 1.1% | 0.6% |
| Workers who walk | 1.2% | 2.7% | 2.8% |
| Working from home | 9.0% | 5.4% | 4.6% |
 Here are the best places to live in California
 Top 10 cities in California with the best education system
 10 best cities to buy a new house in California
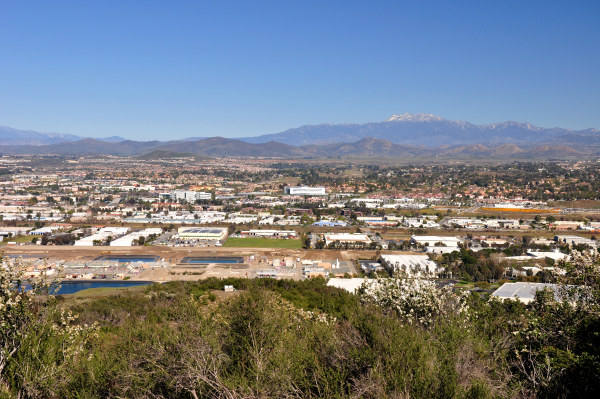 See the best places to live in & around Temecula