An Overview of Cost of Living in South San Francisco, CA
Understanding the cost of living in South San Francisco can help future residents assess whether their current financial situation aligns with the expenses they will encounter. It enables them to plan for potential changes in their budget and lifestyle. The South San Francisco cost of living index is 212, which is 112% higher than the national average. The cost of living index is calculated by taking into account multiple categories, which encompass both the cost of everyday expenditures and larger expenses as well.
If affordability is among your top priorities when searching for a new place to live, this area may not be the ideal fit, as the cost of living in South San Francisco is among the most expensive in the United States. Just a minority of areas exhibit a cost of living at least 20% higher than the national average, and unfortunately, South San Francisco falls into this category, which may not align with your goal of finding a budget-friendly living environment.
Housing costs are a very significant part of the South San Francisco cost of living index and generally encompass a large percentage of take-home income. Unfortunately, in this area, the housing costs for both homes and rentals were 317.3% more than the average city. This includes things like home and rent prices, mortgage rates and insurance.
Goods and services make up 33% of the total cost of living index score and are a large part of your everyday expenses. These items could include things like haircuts, salons, toothpaste, shampoo, clothes, movies, bowling, gym memberships or yoga. In South San Francisco, you can expect to pay 19.9% more than average for these items, making it a more expensive place to live.
Groceries are getting more expensive by the day and the cost of groceries makes up 13% of the overall cost of living index. In the past two years, prices have shot up by over 10%! Unfortunately, in South San Francisco, it's the same story – grocery costs are 22.5% higher than what people pay across the country.
What Do Locals Say About the Cost of Living in South San Francisco?
The most insightful perspective on a city comes from its residents. We recently surveyed 11 locals to gauge their perception of the cost of living in South San Francisco. The feedback revealed that 0% of respondents found the cost of living to be reasonable, with prices on the decline, while 100% regarded it as notably expensive with prices that continue to rise.
Is South San Francisco Affordable?
Is South San Francisco affordable? It's a key consideration when pondering a move, as affordability often shapes your choices. The cost of living index (we discussed it earlier), coupled with housing costs and income levels, serves as the cornerstone for determining a location's affordability. Take South San Francisco, for instance, where the median home price falls 393.2% higher than the national average, and monthly rent rates are 140.1% higher than usual. Additionally, median income levels contribute to the equation, with South San Francisco flaunting a median household income of $106,005, 91.6% higher than the national norm.
What Factors can Influence the Cost of Living in South San Francisco?
Taxes: Locations with elevated tax rates, encompassing both sales and income taxes, can be a factor in driving up the cost of living. When you're paying more in taxes for everyday goods and services, it naturally translates into higher expenses. Similarly, a higher income tax rate can also contribute to an overall higher cost of living. In South San Francisco, the standard sales tax rate starts at 7.25%, and the income tax rates commence at 1%.
Subsidies: Some cities and states may extend government subsidies or aid programs aimed at reducing the cost of living for their residents. These initiatives encompass diverse forms of support, including Medicare, Medicaid, housing subsidies, low-income home energy assistance programs, school lunch programs, supplemental nutrition assistance programs, student loans, electric vehicle tax credits, affordable care act subsidies and farm subsidies. Regions with limited subsidy provisions may witness an increase in their overall cost of living.
Groceries: Over the past 2-3 years, grocery expenses have experienced substantial upward trends. In certain markets, food prices have surged by over 20% during this period, while others have witnessed more modest increases. These fluctuations in food costs can wield significant influence over the overall cost of living in a given region. In South San Francisco, the groceries index is 22.5% higher than the national average.
Where is the Data From?
The cost of living data in South San Francisco displayed above is sourced from the C2ER cost of living index, which serves as a practical tool for comparing living expenses across urban areas. Published on a quarterly basis, this index aggregates data from over 300 independent researchers, encompassing more than 60 goods and services, in 6 different categories. The weightings assigned to cost differences rely on government survey data that tracks the spending habits of professional and executive households. It's worth noting that the C2ER index excludes data on sales or income tax rates, while AreaVibes integrates tax rates into the overall cost of living evaluation for each region.
 Here are the best places to live in California
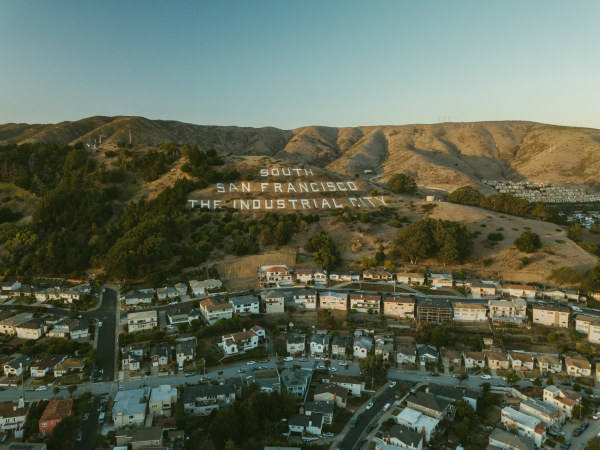 See the best places to live in & around South San Francisco
 Top 10 best public schools in South San Francisco
 10 Best cities in California for employment