| Index | Capitol Hill | Seattle | Washington |
| Median home price | $712,089 | $713,600 | $269,300 |
| Median rent asked | $1,796 | $1,702 | $1,056 |
| Avg. people per household | 1.8 | 2.1 | 2.5 |
| Owner occupied households | 32.1% | 44.9% | 62.4% |
| Renter occupied households | 67.9% | 55.1% | 37.6% |
| Population | Home Price | National Avg. | |
| Fairwood CDP (Spokane County), WA | 8,055 | $224,800 | 22% |
| East Port Orchard, WA | 5,069 | $252,000 | 36% |
| Bremerton, WA | 41,258 | $270,100 | 46% |
| Enetai, WA | 1,993 | $278,200 | 51% |
| Suquamish, WA | 4,327 | $293,700 | 59% |
| Seattle, WA | 741,251 | $713,600 | 286% |
| Population | Home Price | National Avg. | |
| Denver, CO | 715,878 | $427,600 | 132% |
| Washington, DC | 701,974 | $618,100 | 235% |
| Boston, MA | 689,326 | $581,200 | 215% |
| El Paso, TX | 679,879 | $132,800 | 28% |
| Detroit, MI | 672,351 | $52,700 | 71% |
| Seattle, WA | 741,251 | $713,600 | 286% |
 Here are the best places to live in Washington
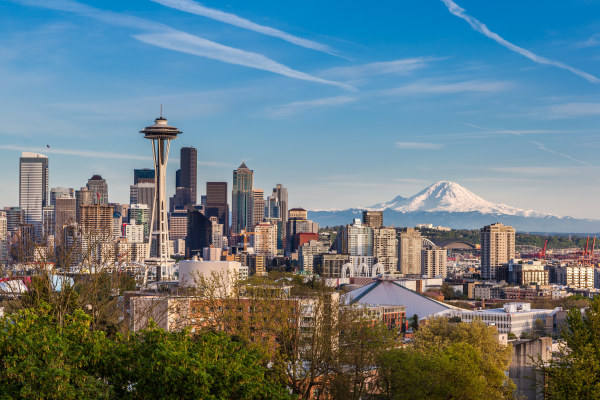 See the best places to live in & around Seattle
 10 Best cities in Washington for employment
 Top 10 cities in Washington with the best education system