An Overview of Cost of Living in North Las Vegas, NV
Getting a feel for the cost of living in North Las Vegas is essential for anyone planning to relocate, as it empowers them to make informed financial decisions, secure a comfortable lifestyle and maintain financial stability in their new environment. The cost of living in North Las Vegas is 108, which is 8% higher than the national average. Relocating individuals may need to adjust their savings and investment strategies based on the cost of living in the new location. It influences decisions about retirement planning, investments and financial goals.
The cost of living in North Las Vegas closely mirrors the national average in comparison to other cities nationwide. Essential items such as groceries, goods and services, health care and utilities are priced at a level consistent with similar urban areas. This means that residents of North Las Vegas can anticipate that their daily expenses will remain reasonably in line with those of an average city, contributing to a manageable cost of living.
Housing costs are a very significant part of the North Las Vegas cost of living index and generally encompass a large percentage of take-home income. Unfortunately, in this area, the housing costs for both homes and rentals were 38.2% more than the average city. This includes things like home and rent prices, mortgage rates and insurance.
Everyday necessities such as clothing, personal hygiene products and recreational activities collectively contribute to the overall cost of living. The favorable news is that in North Las Vegas, these essential goods and services are priced 16.2% below the national average. This translates to the ability to procure essential items and indulge in leisure activities without depleting one's financial resources excessively. With the resulting savings, individuals have the opportunity to allocate additional funds towards their savings or other financial objectives.
Is North Las Vegas Affordable?
Is North Las Vegas affordable? It's a key consideration when pondering a move, as affordability often shapes your choices. The cost of living index (we discussed it earlier), coupled with housing costs and income levels, serves as the cornerstone for determining a location's affordability. Take North Las Vegas, for instance, where the median home price falls 40.8% higher than the national average, and monthly rent rates are 32% higher than usual. Additionally, median income levels contribute to the equation, with North Las Vegas flaunting a median household income of $60,972, 10.2% higher than the national norm.
What Factors can Influence the Cost of Living in North Las Vegas?
Subsidies: Some cities and states may extend government subsidies or aid programs aimed at reducing the cost of living for their residents. These initiatives encompass diverse forms of support, including Medicare, Medicaid, housing subsidies, low-income home energy assistance programs, school lunch programs, supplemental nutrition assistance programs, student loans, electric vehicle tax credits, affordable care act subsidies and farm subsidies. Regions with limited subsidy provisions may witness an increase in their overall cost of living.
Groceries: The costs associated with groceries have witnessed substantial increases over the past 2-3 years. In select markets, food prices have escalated by more than 20% during this timeframe, whereas others have seen more restrained upticks. The variances in food expenses can exert a considerable influence on the overall cost of living in a given locale. In North Las Vegas, the groceries index is 4.9% higher than the national average.
Healthcare: The costs associated with healthcare and insurance premiums can exhibit notable disparities based on the city or state of residence. Access to healthcare facilities, out-of-pocket expenses for medical appointments, dental care charges, prescription medication costs and specialized medical care expenses all contribute to variations in the cost of living. In North Las Vegas, healthcare costs are 11.3% lower than the national average.
Where is the Data From?
The North Las Vegas cost of living data you see above is sourced from the C2ER cost of living index, providing a practical and accurate means of comparing living expenses in urban areas. Updated quarterly, this index gathers data from over 300 independent researchers, covering more than 60 goods and services, in 6 different categories. These selections are made meticulously to represent a wide range of consumer expenditure categories. The weightings applied to cost differences are based on government survey data that tracks spending patterns among professional and executive households. It's important to note that while the C2ER index excludes data on sales or income tax rates, AreaVibes factors tax rates into the overall cost of living score for each region.
 Here are the best places to live in Nevada
 Check out the 10 safest cities in Nevada
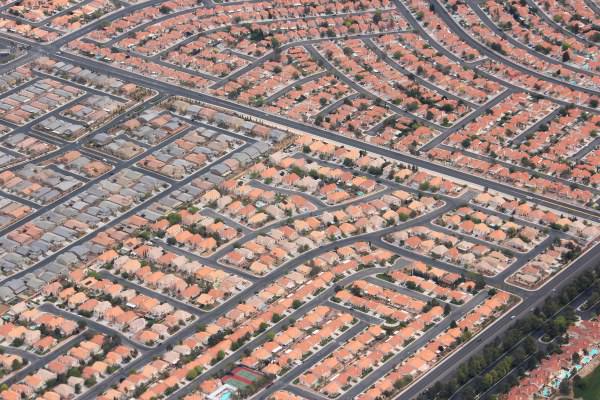 See the best places to live in & around North Las Vegas
 10 Best cities in Nevada for employment