| Statistic | Lancaster | Pennsylvania | National |
| Population | 59,321 | 12,801,989 | 328,239,523 |
| Population density (sq mi) | 8,208 | 287 | 91 |
| Median age | 32.7 | 40.6 | 37.7 |
| Male/Female ratio | 0.9:1 | 1.0:1 | 1.0:1 |
| Married (15yrs & older) | 39% | 56% | 55% |
| Families w/ Kids under 18 | 45% | 40% | 43% |
| Speak English | 65% | 89% | 79% |
| Speak Spanish | 28% | 5% | 13% |
The population of Lancaster is 59,321, with a population density of 8,208 people per square mile, diverging from the national average of 91. The median age is 32.7 and 39% of individuals aged 15 or older are married, while 45% have children under 18. As far as income equality in Lancaster goes, 26% of households have a median income below $25,000, whereas 8% report an income exceeding $150,000. The Lancaster demographics data can provide indispensable insights into the composition, dynamics and needs of cities, towns or even villages, empowering planners, developers and policymakers to devise strategies that foster prosperity, equity and well-being for all residents.
The Lancaster racial demographics and ethnicity breakdown could be indispensable tools for recognizing and rectifying systemic inequities, fostering social justice and inclusion and cultivating resilient communities. In Lancaster, the racial breakdown reveals 58.3% White, 16.9% Black or African American, 4.5% Asian, 0.2% American Indian and 0.1% Native Hawaiian, with 38.9% of the population identifying as Hispanic or Latino. Of all households, 65.5% reported speaking English only, while 28.2% reported speaking Spanish only. Moreover, 12.5% of residents were classified as foreign-born.
In areas with high population density, residents enjoy a wealth of amenities and services conveniently located within walking distance or a short commute. Access to healthcare facilities, educational institutions, cultural venues, dining options, retail stores and public transit enhances residents' quality of life and overall well-being. Lancaster has a population density of 8,208 people per square mile, which far exceeds the national average of 91 and ranks among the most densely populated cities in the country.
Urban Development: By leveraging demographic data in Lancaster, urban planners can tailor areas to meet the needs of any resident across housing, transportation and public services, all while fostering sustainability and elevating quality of life. Demographic changes can fuel gentrification and neighborhood transformation, whether in urban or rural settings. As neighborhoods attract newcomers with varying income levels and lifestyle preferences, property values may appreciate, potentially displacing established residents and reshaping the neighborhood's fabric. A nuanced understanding of population density, age distribution, household size and income levels is pivotal for guiding decisions on zoning, transportation infrastructure, housing development and public amenities. Utilizing the demographic data in planning and implementing affordable housing initiatives can help mitigate displacement risks and promote inclusive communities.
Policy Planning: Demographic data and statistics can inform policy and decision-making processes at various levels of government, as well as in organizations and businesses. By reporting and analyzing Lancaster demographics data, policymakers, government officials and organizational leaders can identify areas of need, allocate resources effectively and develop targeted policies and programs that address the specific needs and priorities of different demographic groups. Lancaster demographics can play a crucial role in policy planning by informing resource allocation, evidence-based decision making, identifying priorities, forecasting future trends, monitoring policy impact and promoting equity and inclusion. By leveraging this data effectively, policymakers can develop policies that are targeted, effective and responsive to the needs of diverse communities.
Education Allocation: Lancaster demographic data can help guide education planning by identifying student demographics, school enrollment trends and educational needs, helping schools and policymakers allocate resources and develop effective educational programs. It can be an essential tool for identifying disparities in educational access and outcomes among different demographic groups, such as racial and ethnic minorities, socio-economic status, or students with disabilities. By disaggregating data by demographic factors, education planners can identify areas of inequity and develop targeted interventions to improve access, support and outcomes for marginalized students. Overall, Lancaster demographic data is invaluable in education for promoting equity, supporting student success, and fostering inclusive learning environments that meet the needs of all students.
| Race | Lancaster | Pennsylvania | National |
| White | 58.26% | 81.37% | 73.35% |
| Black | 16.86% | 11.03% | 12.63% |
| Asian | 4.52% | 3.14% | 5.22% |
| American Indian | 0.24% | 0.20% | 0.82% |
| Native Hawaiian | 0.12% | 0.03% | 0.18% |
| Mixed race | 8.91% | 2.24% | 3.06% |
| Other race | 11.09% | 1.98% | 4.75% |
 Here are the best places to live in Pennsylvania
 Check out the 10 safest cities in Pennsylvania
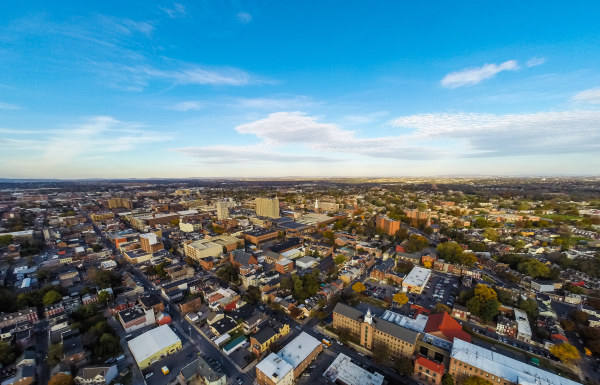 See the best places to live in & around Lancaster
 These are the 10 most affordable cities in Pennsylvania