| Index | Central Business District | Cincinnati | Ohio |
| Income per capita | $70,987 | $32,159 | $27,800 |
| Median household income | $72,038 | $42,663 | $50,674 |
| Median income owner occupied | $0 | $76,377 | $65,077 |
| Median income renter occupied | $0 | $29,930 | $28,832 |
| Median earnings male | $62,347 | $33,438 | $36,579 |
| Median earnings female | $57,394 | $27,464 | $24,862 |
| Unemployment rate | 4.1% | 4.9% | 4.6% |
| Poverty level | n/a | 24.3% | 15.4% |
| Labour Type | Male | Female |
| Construction industry | 1.7% | 1.7% |
| Manufacturing sector | 24.4% | 24.4% |
| Financial & insurance services | 13.5% | 13.5% |
| Wholesale & retail services | 14.6% | 14.6% |
| Public administration | 3.0% | 3.0% |
| Transportation, warehousing & utilities | 3.0% | 3.0% |
| Education, health & social services | 12.8% | 12.8% |
| Other | 24.8% | 24.8% |
| City | Population | Household Income | National Avg. |
| Coldstream, OH | 1,383 | $196,750 | 255.6% |
| The Village of Indian Hill, OH | 5,770 | $190,083 | 243.6% |
| Terrace Park, OH | 2,254 | $176,563 | 219.2% |
| Dry Run, OH | 8,200 | $170,203 | 207.7% |
| Evendale, OH | 2,709 | $161,964 | 192.8% |
| Cincinnati, OH | 302,687 | $42,663 | 22.9% |
| City | Population | Household Income | National Avg. |
| Pittsburgh, PA | 301,286 | $50,536 | 8.7% |
| St. Louis, MO | 304,709 | $45,782 | 17.2% |
| St. Paul, MN | 305,877 | $59,717 | 7.9% |
| Henderson, NV | 309,955 | $75,430 | 36.3% |
| Greensboro, NC | 294,395 | $49,492 | 10.5% |
| Cincinnati, OH | 302,687 | $42,663 | 22.9% |
 Here are the best places to live in Ohio
 Top 10 best public schools in Cincinnati
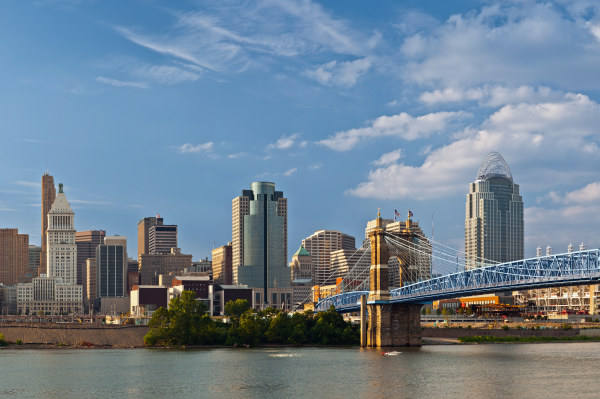 See the best places to live in & around Cincinnati
 Top 10 cities in Ohio with the best education system